
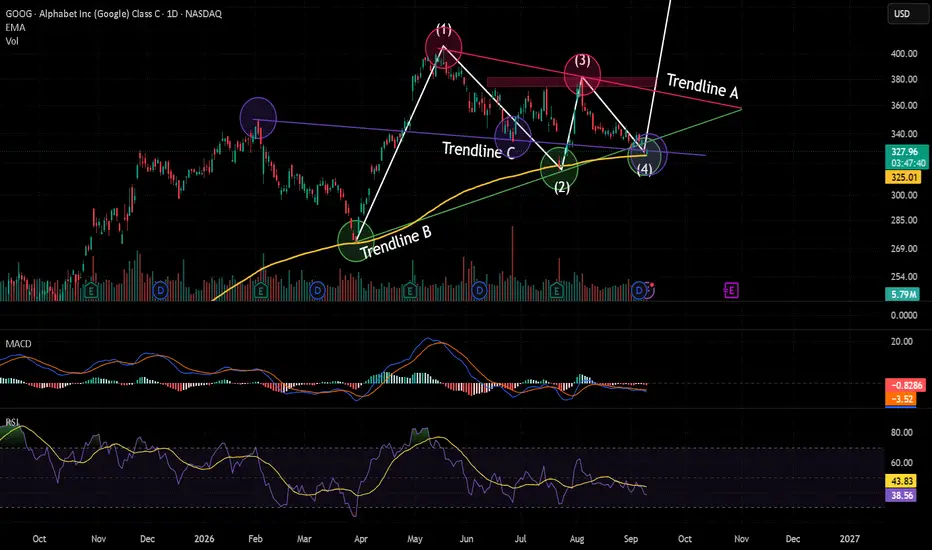
Alphabet (GOOG 1D): Testing 200 EMA & Trendline Confluence – Time for Early Longs? 🌐🚀
🧠 Fundamental Overview (Q2 2026 & Outlook):
Alphabet Inc. (NASDAQ: GOOG / GOOGL) continues to show exceptional operational growth, anchored by the massive scaling of its cloud and artificial intelligence infrastructure:
* Headline Earnings (Q2 2026): Revenue climbed +24% YoY to $119.80 Billion, topping consensus estimates ($116.93B). GAAP diluted EPS printed at $9.11 (boosted by unrealized equity valuation gains), while operational non-GAAP EPS was solid at ~$2.85.
* Cloud & AI Acceleration: Google Cloud surged +82% YoY to $24.77 Billion, with segment operating income tripling to $8.8 Billion and backlog topping $514 Billion.
* CapEx Scrutiny: Full-year 2026 CapEx guidance was raised to $195B–$205B ($44.9B deployed in Q2 alone), as aggressive server and data center commitments continue to weigh on short-term free cash flow.
* Next Earnings Date (Q3 2026): Tentatively scheduled for Wednesday, October 28, 2026 (after market close), with consensus modeling an EPS of ~$2.99.
📊 Technical Breakdown (1D Timeframe):
Zooming into the daily chart, price action is currently sitting right inside a high-interest confluence pocket:

1️⃣ Trendline B & C Confluence with 200 EMA: The price is bouncing directly off the rising 200-day EMA ($325.01 USD). This dynamic baseline has proven to be an institutional line in the sand for Google, holding strong previously on March 30 and July 24. Right here, we also observe a potential false breakdown of Trendline B with price finding support along Trendline C.
2️⃣ Fibonacci "Golden" Accumulation Zone: Measuring the major expansion swing from the $271.54 low up to the $405.28 peak, the price area between $322.63 (61.8% Fib) and $338.41 (50% Fib) marks a textbook accumulation zone. Current prices around $328 sit squarely within this high-probability demand territory.

3️⃣ Oscillators & Momentum Dynamics: Both MACD and RSI (sitting at 38.58) continue to trade in a subdued, corrective posture, compressing without violent swings in either direction. Crucially, neither oscillator is flashing bearish divergence on this bottoming structure, meaning selling pressure is running out of steam rather than accelerating.
4️⃣ Volume Structure: Trading volume has remained low (5.15M–5.55M), which has been a consistent theme across technical inflection points for GOOG this year. While lack of volume doesn't immediately validate an explosive reversal, it indicates an exhaustion of active selling supply.
🎯 Trading Thesis & Execution Plan:
The current structure offers an attractive risk-to-reward setup for early long positions, backed by a technical rebound across Trendlines B and C, the 61.8% Fibonacci zone, and the 200-day EMA.
* Target 1 (TP1): $397 – $405 USD (Confluence of the 61.8% Fibonacci extension and retest of the recent macro highs).
* Target 2 (TP2): $448 USD (Full measured Wave 5 impulse extension).
* Invalidation / Stop Loss: A decisive daily close below the 200 EMA and the Trendline B/C cluster around $320 USD completely invalidates the long thesis, suggesting a deeper structural correction.
Are you bidding the 200 EMA bounce on Google here, or waiting for a breakout above Trendline A? Share your views below! 👇
---
*⚠️ Disclaimer: This analysis is strictly for educational purposes and intended solely to intellectually enrich our trading community. It does NOT constitute financial or investment advice. Always perform your own research and manage your risk strictly.*
🧠 Fundamental Overview (Q2 2026 & Outlook):
Alphabet Inc. (NASDAQ: GOOG / GOOGL) continues to show exceptional operational growth, anchored by the massive scaling of its cloud and artificial intelligence infrastructure:
* Headline Earnings (Q2 2026): Revenue climbed +24% YoY to $119.80 Billion, topping consensus estimates ($116.93B). GAAP diluted EPS printed at $9.11 (boosted by unrealized equity valuation gains), while operational non-GAAP EPS was solid at ~$2.85.
* Cloud & AI Acceleration: Google Cloud surged +82% YoY to $24.77 Billion, with segment operating income tripling to $8.8 Billion and backlog topping $514 Billion.
* CapEx Scrutiny: Full-year 2026 CapEx guidance was raised to $195B–$205B ($44.9B deployed in Q2 alone), as aggressive server and data center commitments continue to weigh on short-term free cash flow.
* Next Earnings Date (Q3 2026): Tentatively scheduled for Wednesday, October 28, 2026 (after market close), with consensus modeling an EPS of ~$2.99.
📊 Technical Breakdown (1D Timeframe):
Zooming into the daily chart, price action is currently sitting right inside a high-interest confluence pocket:
1️⃣ Trendline B & C Confluence with 200 EMA: The price is bouncing directly off the rising 200-day EMA ($325.01 USD). This dynamic baseline has proven to be an institutional line in the sand for Google, holding strong previously on March 30 and July 24. Right here, we also observe a potential false breakdown of Trendline B with price finding support along Trendline C.
2️⃣ Fibonacci "Golden" Accumulation Zone: Measuring the major expansion swing from the $271.54 low up to the $405.28 peak, the price area between $322.63 (61.8% Fib) and $338.41 (50% Fib) marks a textbook accumulation zone. Current prices around $328 sit squarely within this high-probability demand territory.
3️⃣ Oscillators & Momentum Dynamics: Both MACD and RSI (sitting at 38.58) continue to trade in a subdued, corrective posture, compressing without violent swings in either direction. Crucially, neither oscillator is flashing bearish divergence on this bottoming structure, meaning selling pressure is running out of steam rather than accelerating.
4️⃣ Volume Structure: Trading volume has remained low (5.15M–5.55M), which has been a consistent theme across technical inflection points for GOOG this year. While lack of volume doesn't immediately validate an explosive reversal, it indicates an exhaustion of active selling supply.
🎯 Trading Thesis & Execution Plan:
The current structure offers an attractive risk-to-reward setup for early long positions, backed by a technical rebound across Trendlines B and C, the 61.8% Fibonacci zone, and the 200-day EMA.
* Target 1 (TP1): $397 – $405 USD (Confluence of the 61.8% Fibonacci extension and retest of the recent macro highs).
* Target 2 (TP2): $448 USD (Full measured Wave 5 impulse extension).
* Invalidation / Stop Loss: A decisive daily close below the 200 EMA and the Trendline B/C cluster around $320 USD completely invalidates the long thesis, suggesting a deeper structural correction.
Are you bidding the 200 EMA bounce on Google here, or waiting for a breakout above Trendline A? Share your views below! 👇
---
*⚠️ Disclaimer: This analysis is strictly for educational purposes and intended solely to intellectually enrich our trading community. It does NOT constitute financial or investment advice. Always perform your own research and manage your risk strictly.*

Technical and Quant Trading Tools.
Join Us > pragmalgo.com/
Join Us > pragmalgo.com/
Publicaciones relacionadas
Exención de responsabilidad
La información y las publicaciones no constituyen, ni deben considerarse como, asesoramiento o recomendaciones financieras, de inversión, de trading u otro tipo, proporcionadas o respaldadas por TradingView. Obtenga más información en Condiciones de uso.
Technical and Quant Trading Tools.
Join Us > pragmalgo.com/
Join Us > pragmalgo.com/
Publicaciones relacionadas
Exención de responsabilidad
La información y las publicaciones no constituyen, ni deben considerarse como, asesoramiento o recomendaciones financieras, de inversión, de trading u otro tipo, proporcionadas o respaldadas por TradingView. Obtenga más información en Condiciones de uso.