
Weekend comments from Nvidia CEO Jensen Huang which threw some doubt on the size of the company’s future investment in OpenAI initially weighed on technology companies that have AI exposure early on Monday. They helped add to growing uncertainty amongst traders regarding the sustainability of popular trades in the face of the recent collapse in precious metals prices.
These comments also came at a time when the revenue payoff from the huge capital expenditure being made by companies in the AI space is being questioned again, something which was highlighted by the reaction to news of slowing cloud growth reported by Microsoft at the end of January which saw its shares experience their biggest fall in 5 years.
Looking forward to this week, Alphabet may be the next company to face extended scrutiny when it reports its results after the close on Wednesday. Alphabet shares have performed strongly since the release of its latest AI (Gemini) offering in mid-November, catapulting the company to a valuation of over $4 trillion and a ranking of the second biggest company in the world by market capitalisation. In numbers, this has seen a rally of 27% from a low of 270.52 on November 15th up to its latest record peak of 344.83 hit yesterday, after sentiment turned back higher into the close.
When the results are released late on Wednesday evening, traders may not only be looking to judge actual results against lofty expectations but could also focus on future capital expenditure and revenue forecasts to determine how quickly AI spending is contributing to the bottom line. Not only that, updates on the on-going demand for the company’s custom-made AI processors could also help to determine whether Alphabet’s share price trades to even higher levels or experiences a nasty correction to the downside as traders rush to bank profits.
Technical Update: Buyers Still Appear in Control
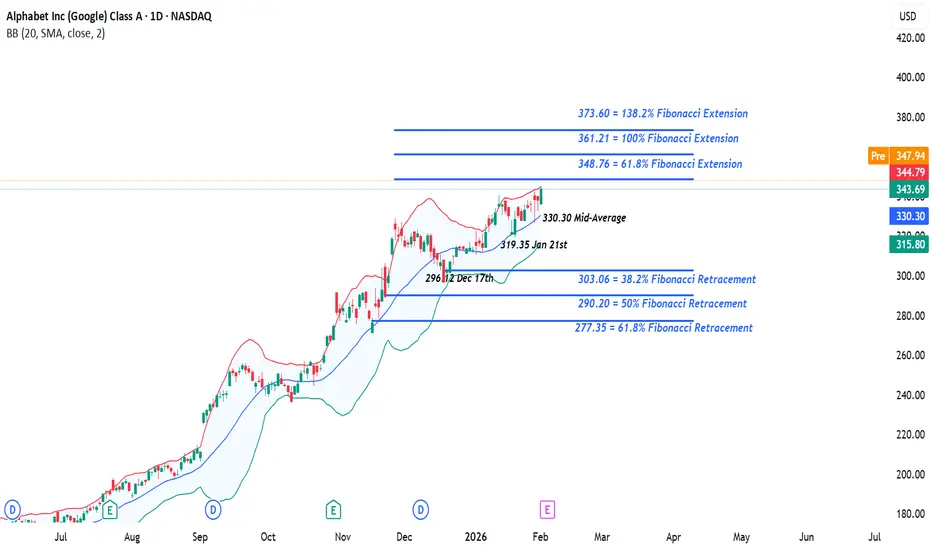
Alphabet has ended 2025 and began 2026 on a strong note, rallying 16.4% from the December 17th low into yesterday’s new all‑time high. This indicates that directional buyers continue to hold the upper hand and that the broader trend in price action remains positive.
Of course, this does not guarantee that price strength will continue, and Wednesday’s earnings release will likely play a key role in shaping future investor sentiment. With that in mind, it’s sensible to monitor the key support and resistance levels that could help assess whether any further price strength, or emerging weakness, is sustainable.
Potential Support Levels:
Last week’s pullback in price found support at the rising Bollinger mid‑average, which is now moving through the 330.30 level. Traders might view this as the first support area in the days ahead. A close below this level could lead to further price weakness as the market unwinds part of Alphabet’s recent advance.

A close below 330.30 could open the way for tests of lower support levels. The first of these supports may sit at 319.35, which is the January 21st session low and prior rally point. If that level is also broken on a closing basis, focus might shift toward 303.06, which is the 38.2% Fibonacci retracement.
Potential Resistance Levels:
Having seen another new all‑time high posted yesterday, the first resistance focus for traders this week may be 348.76, which is the 61.8% Fibonacci extension level. A closing break above 348.76 could suggest that the uptrend still has room to extend.
If a closing break above 348.76 occurs, it could be viewed as a further positive, pointing to scope for continued price strength and opening the way for a move toward 361.21, the 100% Fibonacci extension. A closing break above this level might then shift focus to 373.60, which is the higher 138.2% extension.
The material provided here has not been prepared accordance with legal requirements designed to promote the independence of investment research and as such is considered to be a marketing communication. Whilst it is not subject to any prohibition on dealing ahead of the dissemination of investment research, we will not seek to take any advantage before providing it to our clients.
Pepperstone doesn’t represent that the material provided here is accurate, current or complete, and therefore shouldn’t be relied upon as such. The information, whether from a third party or not, isn’t to be considered as a recommendation; or an offer to buy or sell; or the solicitation of an offer to buy or sell any security, financial product or instrument; or to participate in any particular trading strategy. It does not take into account readers’ financial situation or investment objectives. We advise any readers of this content to seek their own advice. Without the approval of Pepperstone, reproduction or redistribution of this information isn’t permitted.
These comments also came at a time when the revenue payoff from the huge capital expenditure being made by companies in the AI space is being questioned again, something which was highlighted by the reaction to news of slowing cloud growth reported by Microsoft at the end of January which saw its shares experience their biggest fall in 5 years.
Looking forward to this week, Alphabet may be the next company to face extended scrutiny when it reports its results after the close on Wednesday. Alphabet shares have performed strongly since the release of its latest AI (Gemini) offering in mid-November, catapulting the company to a valuation of over $4 trillion and a ranking of the second biggest company in the world by market capitalisation. In numbers, this has seen a rally of 27% from a low of 270.52 on November 15th up to its latest record peak of 344.83 hit yesterday, after sentiment turned back higher into the close.
When the results are released late on Wednesday evening, traders may not only be looking to judge actual results against lofty expectations but could also focus on future capital expenditure and revenue forecasts to determine how quickly AI spending is contributing to the bottom line. Not only that, updates on the on-going demand for the company’s custom-made AI processors could also help to determine whether Alphabet’s share price trades to even higher levels or experiences a nasty correction to the downside as traders rush to bank profits.
Technical Update: Buyers Still Appear in Control
Alphabet has ended 2025 and began 2026 on a strong note, rallying 16.4% from the December 17th low into yesterday’s new all‑time high. This indicates that directional buyers continue to hold the upper hand and that the broader trend in price action remains positive.
Of course, this does not guarantee that price strength will continue, and Wednesday’s earnings release will likely play a key role in shaping future investor sentiment. With that in mind, it’s sensible to monitor the key support and resistance levels that could help assess whether any further price strength, or emerging weakness, is sustainable.
Potential Support Levels:
Last week’s pullback in price found support at the rising Bollinger mid‑average, which is now moving through the 330.30 level. Traders might view this as the first support area in the days ahead. A close below this level could lead to further price weakness as the market unwinds part of Alphabet’s recent advance.
A close below 330.30 could open the way for tests of lower support levels. The first of these supports may sit at 319.35, which is the January 21st session low and prior rally point. If that level is also broken on a closing basis, focus might shift toward 303.06, which is the 38.2% Fibonacci retracement.
Potential Resistance Levels:
Having seen another new all‑time high posted yesterday, the first resistance focus for traders this week may be 348.76, which is the 61.8% Fibonacci extension level. A closing break above 348.76 could suggest that the uptrend still has room to extend.
If a closing break above 348.76 occurs, it could be viewed as a further positive, pointing to scope for continued price strength and opening the way for a move toward 361.21, the 100% Fibonacci extension. A closing break above this level might then shift focus to 373.60, which is the higher 138.2% extension.
The material provided here has not been prepared accordance with legal requirements designed to promote the independence of investment research and as such is considered to be a marketing communication. Whilst it is not subject to any prohibition on dealing ahead of the dissemination of investment research, we will not seek to take any advantage before providing it to our clients.
Pepperstone doesn’t represent that the material provided here is accurate, current or complete, and therefore shouldn’t be relied upon as such. The information, whether from a third party or not, isn’t to be considered as a recommendation; or an offer to buy or sell; or the solicitation of an offer to buy or sell any security, financial product or instrument; or to participate in any particular trading strategy. It does not take into account readers’ financial situation or investment objectives. We advise any readers of this content to seek their own advice. Without the approval of Pepperstone, reproduction or redistribution of this information isn’t permitted.

Global risk Warning CFDs are complex instruments and come with a high risk of losing money rapidly due to leverage. Between 74-89% of retail investor accounts lose money when trading in CFDs. You should consider whether you understand how CFD
Exención de responsabilidad
La información y las publicaciones no constituyen, ni deben considerarse como, asesoramiento o recomendaciones financieras, de inversión, de trading u otro tipo, proporcionadas o respaldadas por TradingView. Obtenga más información en Condiciones de uso.
Global risk Warning CFDs are complex instruments and come with a high risk of losing money rapidly due to leverage. Between 74-89% of retail investor accounts lose money when trading in CFDs. You should consider whether you understand how CFD
Exención de responsabilidad
La información y las publicaciones no constituyen, ni deben considerarse como, asesoramiento o recomendaciones financieras, de inversión, de trading u otro tipo, proporcionadas o respaldadas por TradingView. Obtenga más información en Condiciones de uso.