
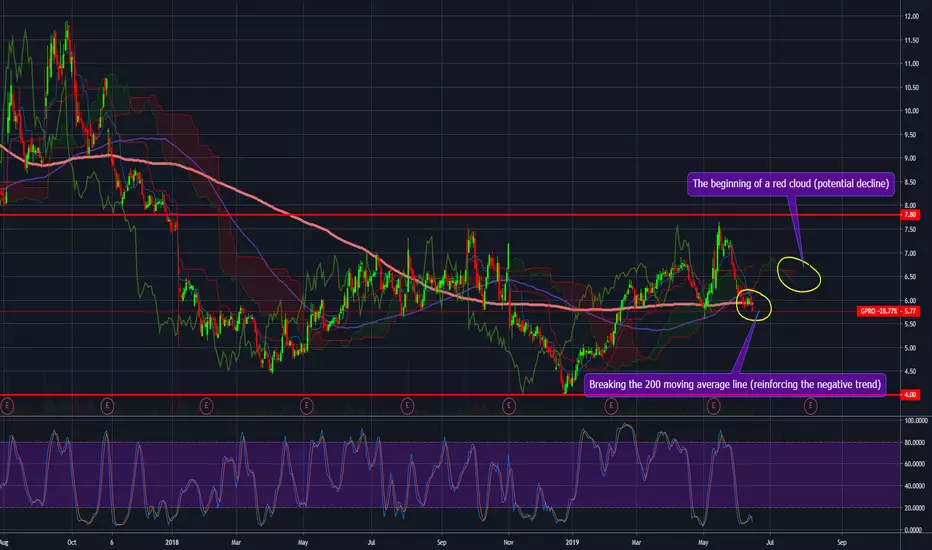
As can be seen in the graph above, there are two very negative signs:
1.The beginning of a red cloud (potential declination).
2. Breaking the 200 moving average line (reinforcing the negative trend).
We think the price will continue to fall, but this is not a new beginning, but rather a continuation of the past that is - the price has ranged from $ 4 to $ 7.8 for several months already.
1.The beginning of a red cloud (potential declination).
2. Breaking the 200 moving average line (reinforcing the negative trend).
We think the price will continue to fall, but this is not a new beginning, but rather a continuation of the past that is - the price has ranged from $ 4 to $ 7.8 for several months already.

Exención de responsabilidad
La información y las publicaciones no constituyen, ni deben considerarse como, asesoramiento o recomendaciones financieras, de inversión, de trading u otro tipo, proporcionadas o respaldadas por TradingView. Obtenga más información en Condiciones de uso.
Exención de responsabilidad
La información y las publicaciones no constituyen, ni deben considerarse como, asesoramiento o recomendaciones financieras, de inversión, de trading u otro tipo, proporcionadas o respaldadas por TradingView. Obtenga más información en Condiciones de uso.