
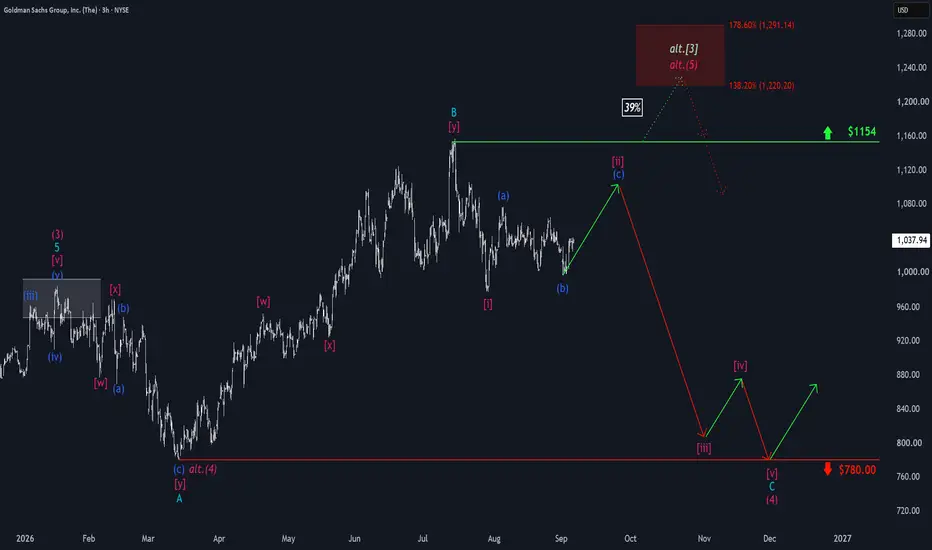
On the first trading day of September, the Goldman Sachs stock slipped just below the $1,000 mark but has since worked its way higher again. Our primary expectation is that the stock is still completing a temporary corrective move to the upside, which should end well below the resistance at $1,154. The price should then decline in stages and form the broader corrective low no later than around the support at $780.00. Once that low is in place, fresh upward moves should unfold. Alternatively, GS could be in the final phase of a broader impulsive move. In that scenario, the stock would break directly above the resistance at $1,154 and advance into our alternative red Target Zone between $1,220.20 and $1,291.14 (probability: 39%). This should then be followed by a significant sell-off as well.

📊 Daily market insights combining macro + Elliott Wave analysis
🚀 Spot trends early with momentum, sentiment & price structure
🌐 Join thousands trading smarter at hkcmglobal.com
🚀 Spot trends early with momentum, sentiment & price structure
🌐 Join thousands trading smarter at hkcmglobal.com
Publicaciones relacionadas
Exención de responsabilidad
La información y las publicaciones no constituyen, ni deben considerarse como, asesoramiento o recomendaciones financieras, de inversión, de trading u otro tipo, proporcionadas o respaldadas por TradingView. Obtenga más información en Condiciones de uso.
📊 Daily market insights combining macro + Elliott Wave analysis
🚀 Spot trends early with momentum, sentiment & price structure
🌐 Join thousands trading smarter at hkcmglobal.com
🚀 Spot trends early with momentum, sentiment & price structure
🌐 Join thousands trading smarter at hkcmglobal.com
Publicaciones relacionadas
Exención de responsabilidad
La información y las publicaciones no constituyen, ni deben considerarse como, asesoramiento o recomendaciones financieras, de inversión, de trading u otro tipo, proporcionadas o respaldadas por TradingView. Obtenga más información en Condiciones de uso.