
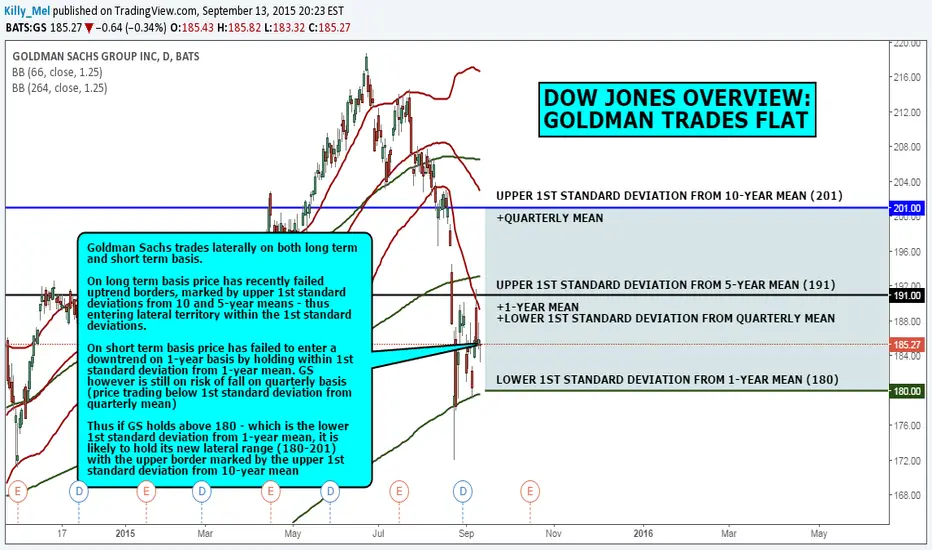
Goldman Sachs trades laterally on both long term and short term basis.
On long term basis price has recently failed uptrend borders, marked by upper 1st standard deviations from 10 and 5-year means - thus entering lateral territory within the 1st standard deviations.
On short term basis price has failed to enter a downtrend on 1-year basis by holding within 1st standard deviation from 1-year mean. GS however is still on risk of fall on quarterly basis (price trading below 1st standard deviation from quarterly mean)
Thus if GS holds above 180 - which is the lower 1st standard deviation from 1-year mean, it is likely to hold its new lateral range (180-201) with the upper border marked by the upper 1st standard deviation from 10-year mean
On long term basis price has recently failed uptrend borders, marked by upper 1st standard deviations from 10 and 5-year means - thus entering lateral territory within the 1st standard deviations.
On short term basis price has failed to enter a downtrend on 1-year basis by holding within 1st standard deviation from 1-year mean. GS however is still on risk of fall on quarterly basis (price trading below 1st standard deviation from quarterly mean)
Thus if GS holds above 180 - which is the lower 1st standard deviation from 1-year mean, it is likely to hold its new lateral range (180-201) with the upper border marked by the upper 1st standard deviation from 10-year mean

Exención de responsabilidad
La información y las publicaciones no constituyen, ni deben considerarse como, asesoramiento o recomendaciones financieras, de inversión, de trading u otro tipo, proporcionadas o respaldadas por TradingView. Obtenga más información en Condiciones de uso.
Exención de responsabilidad
La información y las publicaciones no constituyen, ni deben considerarse como, asesoramiento o recomendaciones financieras, de inversión, de trading u otro tipo, proporcionadas o respaldadas por TradingView. Obtenga más información en Condiciones de uso.