
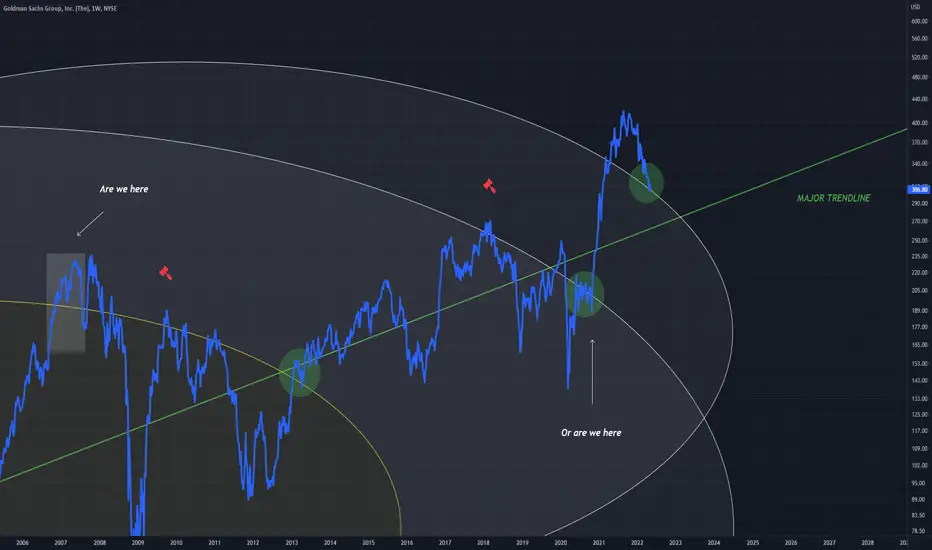
There are two positions we are either in
The white rectangle which is the beginning of a rejection pattern along the circle, or a green circle which is a bullish pattern that finds support on the circle
I am leaning more towards the green circle position (bullish state) due to the position price being quite highly above the circle and it is more comparable to the green circle on the yellow fib ring
Being above the green trend line adds to this bullish assumption
This is the Weekly chart for GS (Goldman Sachs)
The white rectangle which is the beginning of a rejection pattern along the circle, or a green circle which is a bullish pattern that finds support on the circle
I am leaning more towards the green circle position (bullish state) due to the position price being quite highly above the circle and it is more comparable to the green circle on the yellow fib ring
Being above the green trend line adds to this bullish assumption
This is the Weekly chart for GS (Goldman Sachs)

Exención de responsabilidad
La información y las publicaciones no constituyen, ni deben considerarse como, asesoramiento o recomendaciones financieras, de inversión, de trading u otro tipo, proporcionadas o respaldadas por TradingView. Obtenga más información en Condiciones de uso.
Exención de responsabilidad
La información y las publicaciones no constituyen, ni deben considerarse como, asesoramiento o recomendaciones financieras, de inversión, de trading u otro tipo, proporcionadas o respaldadas por TradingView. Obtenga más información en Condiciones de uso.