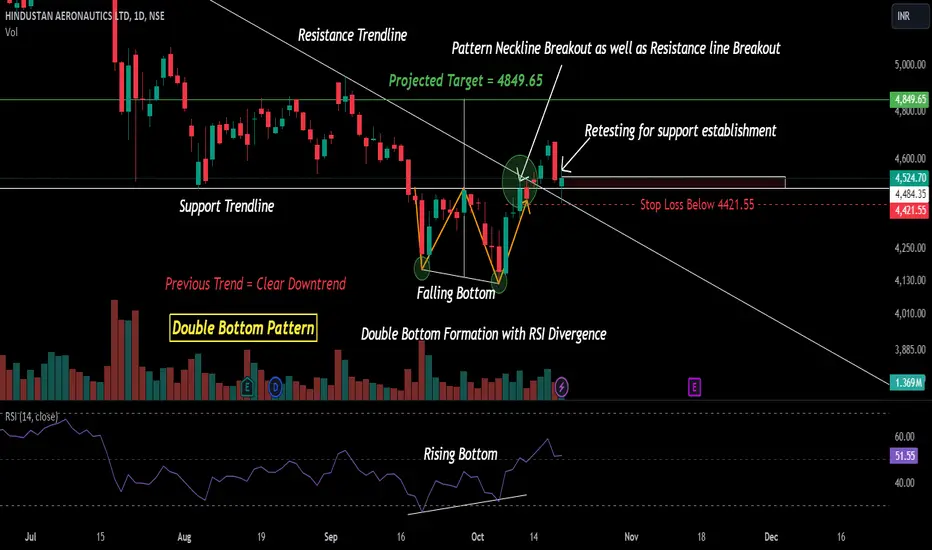
Double Bottom Pattern with an RSI Divergence in HAL on a Daily Timeframe!
Double Bottom Pattern Formation in HAL !
HAL !
Neckline Breakout in HAL!
Analysis:
HAL has made a Double bottom pattern on a daily timeframe after its downtrend so the trend is most likely to change. As we can see price made falling bottoms but RSI has made rising bottoms so there is a clear divergence as I have indicated in the chart. We also can see the optimum volume during the breakout and also the stock is retesting its new support.
Trade Setup:
Refer to the Analysis and make your own decisions as per your Risk to Reward Ratio
Disclaimer:
Consider my analysis for Educational Purposes only.
Before entering into any trade -
1) Educate Yourself
2) Do your research and analysis
3) Define your Risk to Reward ratio
4) Don't trade with full capital
Double Bottom Pattern Formation in
HAL !Neckline Breakout in HAL!
Analysis:
HAL has made a Double bottom pattern on a daily timeframe after its downtrend so the trend is most likely to change. As we can see price made falling bottoms but RSI has made rising bottoms so there is a clear divergence as I have indicated in the chart. We also can see the optimum volume during the breakout and also the stock is retesting its new support.
Trade Setup:
Refer to the Analysis and make your own decisions as per your Risk to Reward Ratio
Disclaimer:
Consider my analysis for Educational Purposes only.
Before entering into any trade -
1) Educate Yourself
2) Do your research and analysis
3) Define your Risk to Reward ratio
4) Don't trade with full capital
Operación cerrada: precio stop alcanzado
Pattern Failure!
Publicaciones relacionadas
Exención de responsabilidad
La información y las publicaciones no constituyen, ni deben considerarse como, asesoramiento o recomendaciones financieras, de inversión, de trading u otro tipo, proporcionadas o respaldadas por TradingView. Obtenga más información en Condiciones de uso.
Publicaciones relacionadas
Exención de responsabilidad
La información y las publicaciones no constituyen, ni deben considerarse como, asesoramiento o recomendaciones financieras, de inversión, de trading u otro tipo, proporcionadas o respaldadas por TradingView. Obtenga más información en Condiciones de uso.