
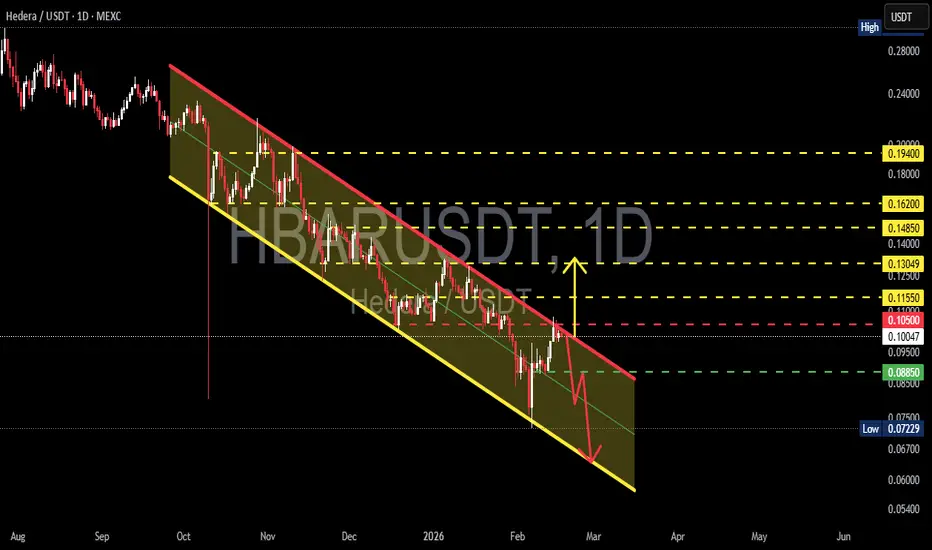
On the 1D timeframe, HBAR/USDT is still under medium-term bearish pressure. Price has been moving consistently inside a descending / falling channel since the previous peak, indicating that sellers remain dominant.
The market structure shows:
Lower Highs
Lower Lows
Rejections at the upper trendline
Currently, price is testing the channel resistance along with a horizontal resistance zone, making this a crucial decision area for the next move.
---
Pattern Explanation
The main pattern visible on the chart is a:
Falling Channel / Descending Channel
Key characteristics:
1. Two parallel downward trendlines
Upper trendline = Dynamic Resistance
Lower trendline = Dynamic Support
2. Repeated price bounces within the channel
3. Volume tends to weaken on rallies and increase on drops → distribution indication
Theoretically:
A Falling Channel can act as a bullish reversal pattern if an upside breakout occurs
Until breakout happens → it remains a bearish continuation structure
---
Key Levels
Layered Resistances
0.10500 → Minor resistance / latest rejection
0.11550 → Horizontal resistance
0.13049 → Mid resistance
0.14850 → Major resistance
0.16200
0.19400 → Macro key resistance
Supports
0.08850 → Near-term support / temporary base
Channel lower trendline
0.07229 → Previous swing low / extreme support
---
Bullish Scenario
Bullish confirmation requires a channel + resistance breakout.
Flow scenario:
1. Price breaks above the falling channel upper trendline
2. Daily candle closes above 0.10500
3. Successful retest turns resistance into support
Upside targets:
0.11550
0.13049
0.14850
0.16200
0.19400 (major target)
This move would likely be supported by:
Volume expansion
Broader crypto market strength
Weakening BTC dominance
A valid breakout could shift structure from bearish to sideways or bullish reversal.
---
Bearish Scenario
If breakout fails, the channel remains a bearish continuation pattern.
Bearish confirmations:
1. Rejection at the upper trendline
2. Failure to hold above 0.10500
3. Breakdown below 0.08850
Downside targets:
Mid-channel support
Lower channel trendline
0.07229
If the lower support breaks → potential:
Capitulation wick
New lower low
Deeper bearish continuation
---
Conclusion
HBAR/USDT is currently at a key decision zone.
Channel breakout → upside reversal potential
Rejection → continuation to the downside
As long as price remains inside the falling channel, the bias stays bearish-to-neutral.
Traders should wait for:
Breakout confirmation for long positions
Clear rejection for short positions
Key level discipline remains essential.
#HBAR #HBARUSDT #CryptoAnalysis #TechnicalAnalysis #Altcoins #CryptoTrading #FallingChannel #BearishTrend #BullishBreakout #SupportResistance #ChartPattern #CryptoMarket #PriceAction #TrendAnalysis
The market structure shows:
Lower Highs
Lower Lows
Rejections at the upper trendline
Currently, price is testing the channel resistance along with a horizontal resistance zone, making this a crucial decision area for the next move.
---
Pattern Explanation
The main pattern visible on the chart is a:
Falling Channel / Descending Channel
Key characteristics:
1. Two parallel downward trendlines
Upper trendline = Dynamic Resistance
Lower trendline = Dynamic Support
2. Repeated price bounces within the channel
3. Volume tends to weaken on rallies and increase on drops → distribution indication
Theoretically:
A Falling Channel can act as a bullish reversal pattern if an upside breakout occurs
Until breakout happens → it remains a bearish continuation structure
---
Key Levels
Layered Resistances
0.10500 → Minor resistance / latest rejection
0.11550 → Horizontal resistance
0.13049 → Mid resistance
0.14850 → Major resistance
0.16200
0.19400 → Macro key resistance
Supports
0.08850 → Near-term support / temporary base
Channel lower trendline
0.07229 → Previous swing low / extreme support
---
Bullish Scenario
Bullish confirmation requires a channel + resistance breakout.
Flow scenario:
1. Price breaks above the falling channel upper trendline
2. Daily candle closes above 0.10500
3. Successful retest turns resistance into support
Upside targets:
0.11550
0.13049
0.14850
0.16200
0.19400 (major target)
This move would likely be supported by:
Volume expansion
Broader crypto market strength
Weakening BTC dominance
A valid breakout could shift structure from bearish to sideways or bullish reversal.
---
Bearish Scenario
If breakout fails, the channel remains a bearish continuation pattern.
Bearish confirmations:
1. Rejection at the upper trendline
2. Failure to hold above 0.10500
3. Breakdown below 0.08850
Downside targets:
Mid-channel support
Lower channel trendline
0.07229
If the lower support breaks → potential:
Capitulation wick
New lower low
Deeper bearish continuation
---
Conclusion
HBAR/USDT is currently at a key decision zone.
Channel breakout → upside reversal potential
Rejection → continuation to the downside
As long as price remains inside the falling channel, the bias stays bearish-to-neutral.
Traders should wait for:
Breakout confirmation for long positions
Clear rejection for short positions
Key level discipline remains essential.
#HBAR #HBARUSDT #CryptoAnalysis #TechnicalAnalysis #Altcoins #CryptoTrading #FallingChannel #BearishTrend #BullishBreakout #SupportResistance #ChartPattern #CryptoMarket #PriceAction #TrendAnalysis

✅ Get Free Signals! Join Our Telegram Channel Here: t.me/TheCryptoNuclear
✅ Twitter: twitter.com/crypto_nuclear
✅ Join Bybit : partner.bybit.com/b/nuclearvip
✅ Benefits : Lifetime Trading Fee Discount -50%
✅ Twitter: twitter.com/crypto_nuclear
✅ Join Bybit : partner.bybit.com/b/nuclearvip
✅ Benefits : Lifetime Trading Fee Discount -50%
Exención de responsabilidad
La información y las publicaciones no constituyen, ni deben considerarse como, asesoramiento o recomendaciones financieras, de inversión, de trading u otro tipo, proporcionadas o respaldadas por TradingView. Obtenga más información en Condiciones de uso.
✅ Get Free Signals! Join Our Telegram Channel Here: t.me/TheCryptoNuclear
✅ Twitter: twitter.com/crypto_nuclear
✅ Join Bybit : partner.bybit.com/b/nuclearvip
✅ Benefits : Lifetime Trading Fee Discount -50%
✅ Twitter: twitter.com/crypto_nuclear
✅ Join Bybit : partner.bybit.com/b/nuclearvip
✅ Benefits : Lifetime Trading Fee Discount -50%
Exención de responsabilidad
La información y las publicaciones no constituyen, ni deben considerarse como, asesoramiento o recomendaciones financieras, de inversión, de trading u otro tipo, proporcionadas o respaldadas por TradingView. Obtenga más información en Condiciones de uso.