Largo
HEX 3D CHART- Is the Bottom In?
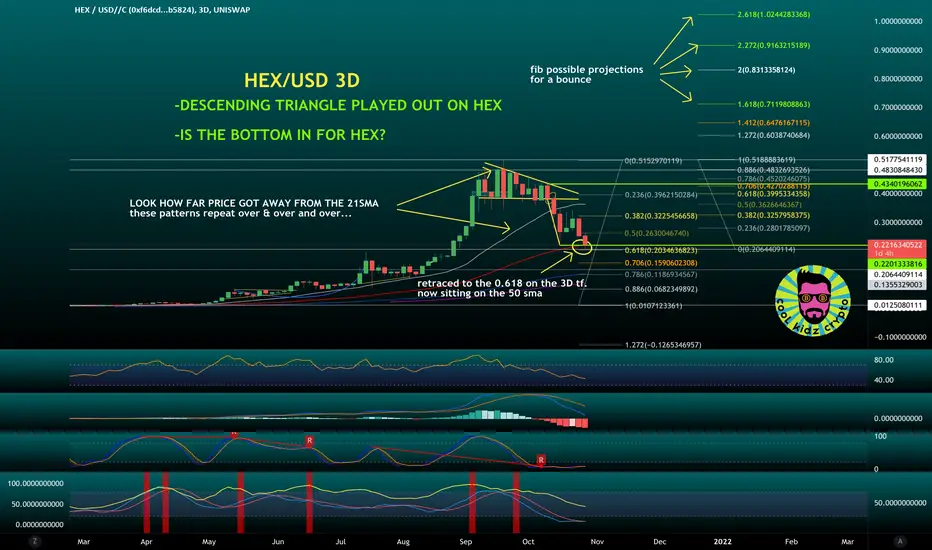
HEX 3D CHART W/ ANALYSIS
⚪️ANALYSIS
Descending triangle played out to a tee. Meas. Move to the 0.618. Investors like to play these golden pockets for area to pick up retracements. Fib possible projections are outined on the chart for a bounce if HEX break ATH.
SRSI Low
MACD Low
FIB Retracement to the 0.618
*Note about the bottom indicator.
Would like to see the YELLOW line (regular Stoch) dip to oversold region as well but not necessary. if all 3 indicators get to a “bundle” under the oversole area + it throws a MTF (multi time Frame) stoch buy (green buy signal) then on these higher time frames it can really be a great sign for reversal.
We are simply looking for as many points of colfluence as we can find. That what gives us an egde.
DISCLAIMER: NOT FINANCIAL ADVICE
FOR EDUCATIONAL PURPOSES ONLY

Exención de responsabilidad
La información y las publicaciones no constituyen, ni deben considerarse como, asesoramiento o recomendaciones financieras, de inversión, de trading u otro tipo, proporcionadas o respaldadas por TradingView. Obtenga más información en Condiciones de uso.
Exención de responsabilidad
La información y las publicaciones no constituyen, ni deben considerarse como, asesoramiento o recomendaciones financieras, de inversión, de trading u otro tipo, proporcionadas o respaldadas por TradingView. Obtenga más información en Condiciones de uso.