
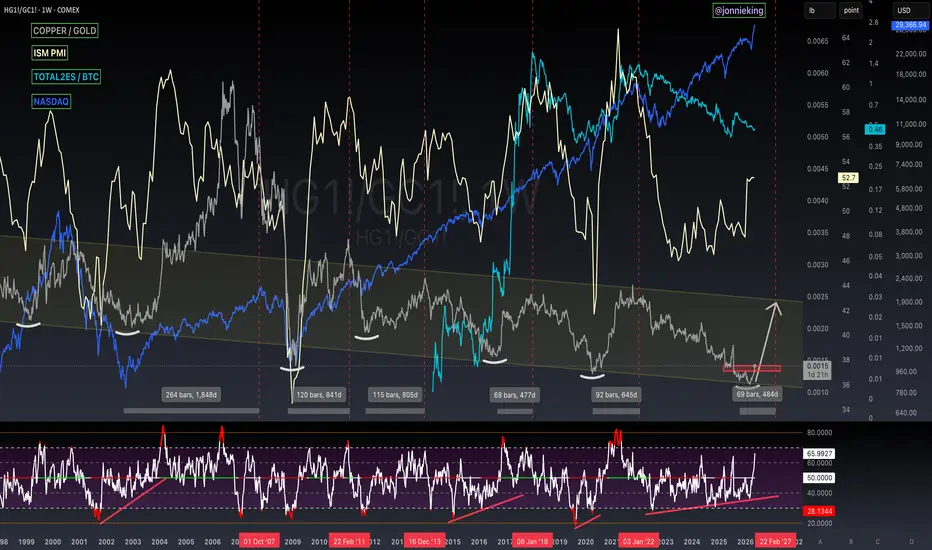
It’s been a while since I gave an update on this chart.
Looks like I called the bottom on COPPER / GOLD in Nov. ’25.
Huge breakout pending critical resistance.
“In 2016 When the ISM climbed above 50, COPPER soon found a bottom and Alts ripped.
Notice the bullish divergence on the RSI during that time, same as we are seeing now.
It looking like C/G may have found a bottom on this multi-decade parallel channel. “
Stocks have benefited very well from this, not so much crypto.
Macro is fascinating at the current moment to say the least.
Looks like I called the bottom on COPPER / GOLD in Nov. ’25.
Huge breakout pending critical resistance.
“In 2016 When the ISM climbed above 50, COPPER soon found a bottom and Alts ripped.
Notice the bullish divergence on the RSI during that time, same as we are seeing now.
It looking like C/G may have found a bottom on this multi-decade parallel channel. “
Stocks have benefited very well from this, not so much crypto.
Macro is fascinating at the current moment to say the least.

Publicaciones relacionadas
Exención de responsabilidad
La información y las publicaciones no constituyen, ni deben considerarse como, asesoramiento o recomendaciones financieras, de inversión, de trading u otro tipo, proporcionadas o respaldadas por TradingView. Obtenga más información en Condiciones de uso.
Publicaciones relacionadas
Exención de responsabilidad
La información y las publicaciones no constituyen, ni deben considerarse como, asesoramiento o recomendaciones financieras, de inversión, de trading u otro tipo, proporcionadas o respaldadas por TradingView. Obtenga más información en Condiciones de uso.