
🔹 Key Technical Zones
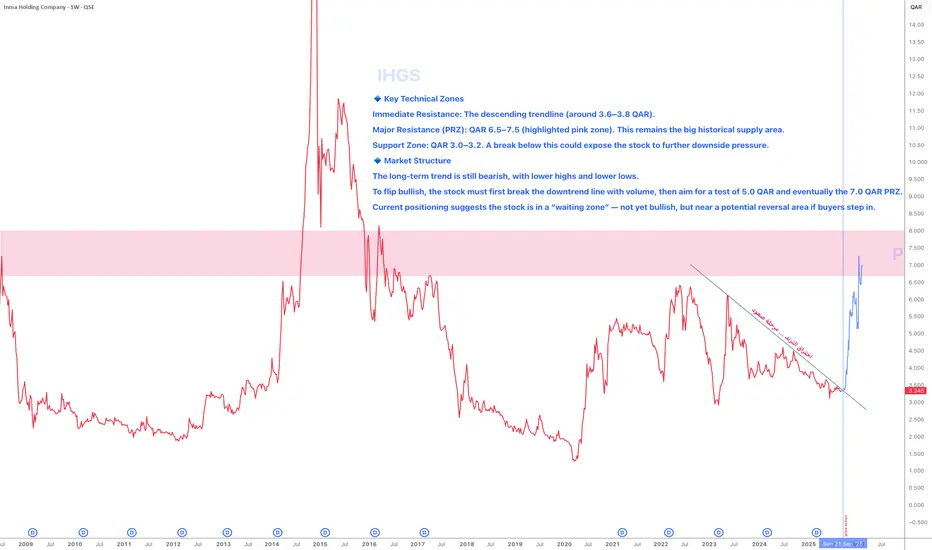
Immediate Resistance: The descending trendline (around 3.6–3.8 QAR).
Major Resistance (PRZ): QAR 6.5–7.5 (highlighted pink zone). This remains the big historical supply area.
Support Zone: QAR 3.0–3.2. A break below this could expose the stock to further downside pressure.
🔹 Market Structure
The long-term trend is still bearish, with lower highs and lower lows.
To flip bullish, the stock must first break the downtrend line with volume, then aim for a test of 5.0 QAR and eventually the 7.0 QAR PRZ.
Current positioning suggests the stock is in a “waiting zone” — not yet bullish, but near a potential reversal area if buyers step in.
Immediate Resistance: The descending trendline (around 3.6–3.8 QAR).
Major Resistance (PRZ): QAR 6.5–7.5 (highlighted pink zone). This remains the big historical supply area.
Support Zone: QAR 3.0–3.2. A break below this could expose the stock to further downside pressure.
🔹 Market Structure
The long-term trend is still bearish, with lower highs and lower lows.
To flip bullish, the stock must first break the downtrend line with volume, then aim for a test of 5.0 QAR and eventually the 7.0 QAR PRZ.
Current positioning suggests the stock is in a “waiting zone” — not yet bullish, but near a potential reversal area if buyers step in.

Exención de responsabilidad
La información y las publicaciones no constituyen, ni deben considerarse como, asesoramiento o recomendaciones financieras, de inversión, de trading u otro tipo, proporcionadas o respaldadas por TradingView. Obtenga más información en Condiciones de uso.
Exención de responsabilidad
La información y las publicaciones no constituyen, ni deben considerarse como, asesoramiento o recomendaciones financieras, de inversión, de trading u otro tipo, proporcionadas o respaldadas por TradingView. Obtenga más información en Condiciones de uso.