
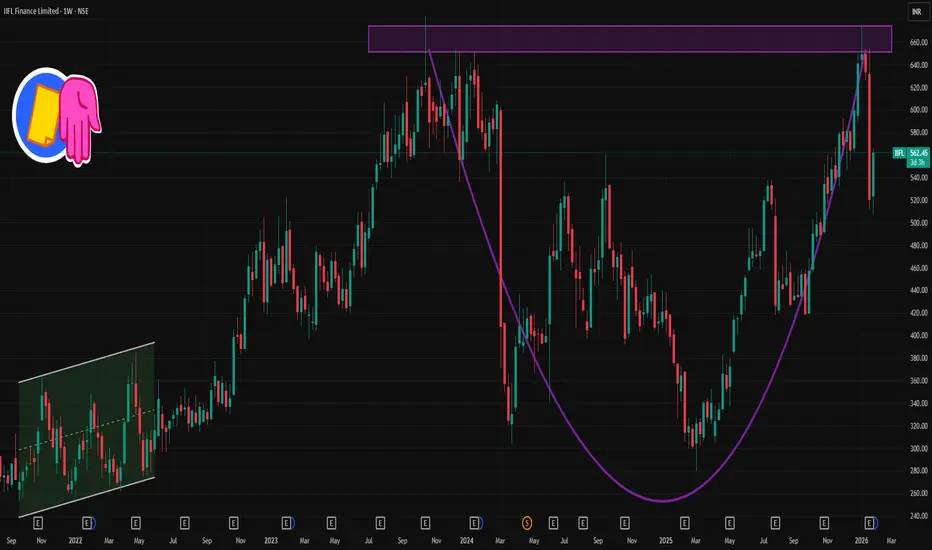
📊 Current Price Snapshot
IIFL Finance share price: ~₹560–₹565 on NSE (today’s range) — with highs around ₹565 and lows near ₹540.45 earlier in today’s session.
📈 Weekly Support & Resistance (Key Levels)
These levels are derived from weekly pivot and longer‑term technical distribution — useful for swing/weekly traders:
🔹 Major Weekly Pivot Zone
Weekly Central Pivot (CPR): ~₹562–₹564 — this zone acts as the pivot around which weekly direction may tilt.
🔹 Weekly Resistance Levels
R1: ~₹613–₹616 — first major resistance if price rallies above current.
R2: ~₹650–₹672 — next higher resistance zone aligned with recent 52‑week highs.
R3: ~₹705+ — extended bullish breakout target.
🔻 Weekly Support Levels
S1: ~₹470–₹472 — first major support if selling accelerates.
S2: ~₹418–₹420 — secondary support from larger weekly pivots.
S3: ~₹326–₹330 — lowest weekly pivot support (deep correction scenario).
🧠 What this means (Weekly Macro View)
📍 Bullish Scenario
If price closes above the pivot zone (~₹562–564) on weekly charts, look for upside momentum toward ₹613–₹650 next.
📉 Bearish Scenario
A weekly close below ~₹470–₹472 could open deeper correction toward ₹418–₹380 support cluster.
IIFL Finance share price: ~₹560–₹565 on NSE (today’s range) — with highs around ₹565 and lows near ₹540.45 earlier in today’s session.
📈 Weekly Support & Resistance (Key Levels)
These levels are derived from weekly pivot and longer‑term technical distribution — useful for swing/weekly traders:
🔹 Major Weekly Pivot Zone
Weekly Central Pivot (CPR): ~₹562–₹564 — this zone acts as the pivot around which weekly direction may tilt.
🔹 Weekly Resistance Levels
R1: ~₹613–₹616 — first major resistance if price rallies above current.
R2: ~₹650–₹672 — next higher resistance zone aligned with recent 52‑week highs.
R3: ~₹705+ — extended bullish breakout target.
🔻 Weekly Support Levels
S1: ~₹470–₹472 — first major support if selling accelerates.
S2: ~₹418–₹420 — secondary support from larger weekly pivots.
S3: ~₹326–₹330 — lowest weekly pivot support (deep correction scenario).
🧠 What this means (Weekly Macro View)
📍 Bullish Scenario
If price closes above the pivot zone (~₹562–564) on weekly charts, look for upside momentum toward ₹613–₹650 next.
📉 Bearish Scenario
A weekly close below ~₹470–₹472 could open deeper correction toward ₹418–₹380 support cluster.

Contact Knowledgehub for a detailed consultation: Dm on WhatsApp: [wa.link/a2o0kz]-
Phone No: [+91 93102 26243]-
Email: [tradingviewknowledgehub@gmail.com]---
-- Let’s achieve success together!
Phone No: [+91 93102 26243]-
Email: [tradingviewknowledgehub@gmail.com]---
-- Let’s achieve success together!
Publicaciones relacionadas
Exención de responsabilidad
La información y las publicaciones no constituyen, ni deben considerarse como, asesoramiento o recomendaciones financieras, de inversión, de trading u otro tipo, proporcionadas o respaldadas por TradingView. Obtenga más información en Condiciones de uso.
Contact Knowledgehub for a detailed consultation: Dm on WhatsApp: [wa.link/a2o0kz]-
Phone No: [+91 93102 26243]-
Email: [tradingviewknowledgehub@gmail.com]---
-- Let’s achieve success together!
Phone No: [+91 93102 26243]-
Email: [tradingviewknowledgehub@gmail.com]---
-- Let’s achieve success together!
Publicaciones relacionadas
Exención de responsabilidad
La información y las publicaciones no constituyen, ni deben considerarse como, asesoramiento o recomendaciones financieras, de inversión, de trading u otro tipo, proporcionadas o respaldadas por TradingView. Obtenga más información en Condiciones de uso.