
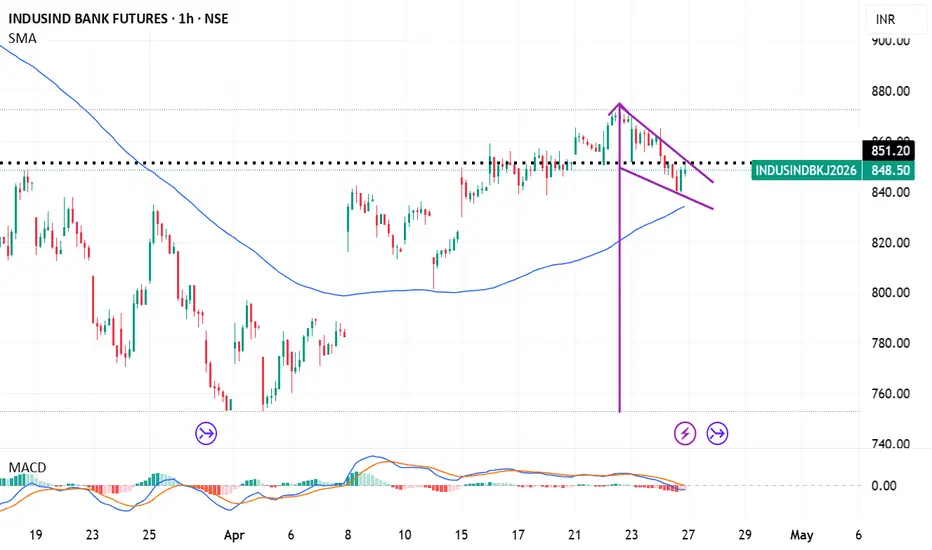
Based on technical analysis of the hourly chart, here is the breakdown of the potential pole and flag setup for IndusInd Bank (INDUSINDBK) around April 24, 2026.
Pattern: Bullish Pole and Flag (Continuation Pattern)
Entry Strategy: Wait for a clear breakout above the flag resistance (around ₹865-870) on high volume on the hourly chart.
Stop Loss (SL): ₹825 (Tight SL) or below ₹820 (Ideal).
Target (T1): ₹900 (Immediate Resistance).
Target (T2): ₹920+ (Target based on flagpole height projection)
Operación cerrada: objetivo alcanzado

Exención de responsabilidad
La información y las publicaciones no constituyen, ni deben considerarse como, asesoramiento o recomendaciones financieras, de inversión, de trading u otro tipo, proporcionadas o respaldadas por TradingView. Obtenga más información en Condiciones de uso.
Exención de responsabilidad
La información y las publicaciones no constituyen, ni deben considerarse como, asesoramiento o recomendaciones financieras, de inversión, de trading u otro tipo, proporcionadas o respaldadas por TradingView. Obtenga más información en Condiciones de uso.