
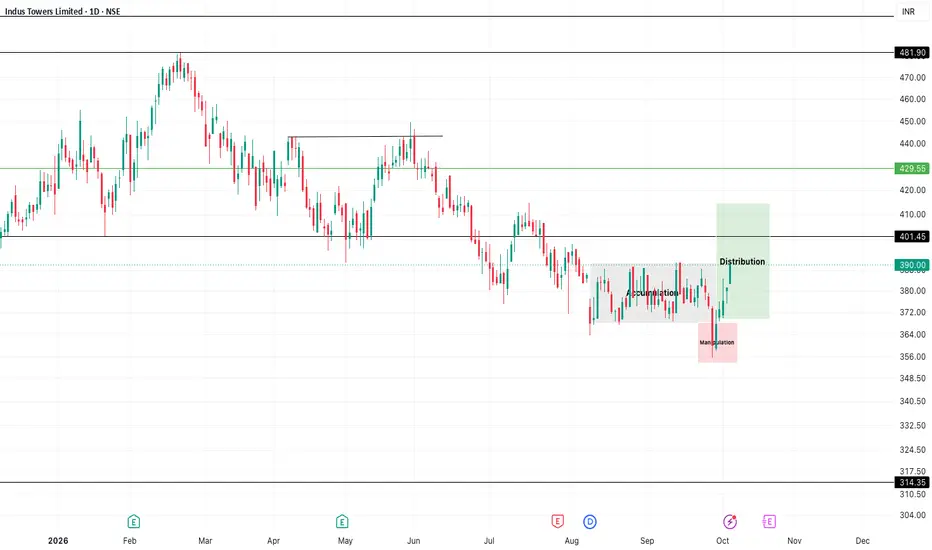
AMD — Accumulation, Manipulation & Distribution
In Smart Money Concepts (SMC), AMD is a powerful way to understand why price often consolidates, makes a deceptive move, and then delivers the real directional move.


5
1. Accumulation — Build the Position
This is the phase where price usually moves sideways inside a range.
What you see:
* Equal highs / equal lows
* Tight consolidation
* Repeated support and resistance
* Liquidity building above and below the range
* No clear directional expansion
SMC interpretation: Large participants may be building positions while the market creates liquidity for the next move.
Think:
Range → Liquidity builds → Traders place stops
2. Manipulation — Take the Liquidity
This is the most important part of AMD.
Price temporarily moves outside the accumulation range, often taking obvious liquidity.
For example:
Bullish scenario:
Buy-side liquidity
─────────────────────────
↑
│ Manipulation
│ sweep
┌────────┴─────────┐
│ ACCUMULATION │
│ RANGE │
└──────────────────┘
↓
Sell-side liquidity
Price may:
1. Break below the range.
2. Trigger sell orders and stop losses.
3. Reach a liquidity pool.
4. Reject the area.
5. Reverse aggressively upward.
This is often called a liquidity sweep / stop hunt.
The key idea
Do not automatically trade the breakout.
A breakout can be the manipulation, not the real move.
3. Distribution — The Real Expansion
After liquidity has been taken, price can begin the actual directional move.
For a bullish AMD:
ACCUMULATION
↓
LIQUIDITY SWEEP
↓
MARKET STRUCTURE SHIFT
↓
DISPLACEMENT
↓
FVG / ORDER BLOCK
↓
DISTRIBUTION ↑↑↑
You want to see confirmation such as:
* Liquidity sweep
* Strong displacement
* MSS/BOS
* FVG formation
* Order-block reaction
* Continuation toward opposing liquidity
🔥 AMD + SMC Entry Model
A high-quality setup can look like this:
Step 1 — Identify the range
Mark:
* Range High
* Range Low
* Equal Highs
* Equal Lows
Step 2 — Identify liquidity
Ask:
Where are traders likely to put their stops?
Above:
* Previous highs
* Equal highs
* Session highs
Below:
* Previous lows
* Equal lows
* Session lows
Step 3 — Wait for manipulation
Don't enter simply because price reaches the liquidity.
Wait for a sweep.
Step 4 — Look for displacement
After the sweep, look for an aggressive candle sequence showing that order flow has changed.
Step 5 — Confirm MSS/BOS
For example:
Previous High
────────
│
│
/\ │
/ \____│
/ │
───┘ │
↓
Liquidity Sweep
↑
│
Strong move
↑
MSS / BOS
↑
Entry
Step 6 — Find the entry
Potential entry locations:
A. Fair Value Gap (FVG) Price retraces into the imbalance after displacement.
B. Order Block Price returns to the institutional-looking origin of the displacement.
C. Breaker A failed order block can become a breaker structure.
🧠 AMD Is Not Always Three Perfect Phases
This is extremely important.
AMD is a market behavior model, not a rigid pattern.
You won't always get:
Perfect accumulation → perfect manipulation → perfect distribution.
Sometimes:
* Manipulation happens very quickly.
* Accumulation lasts hours/days.
* Multiple liquidity sweeps occur.
* Distribution begins without a deep retracement.
* AMD occurs on one timeframe while another timeframe shows a completely different structure.
Therefore, context + liquidity + structure + displacement matter more than simply labeling candles as AMD.
In Smart Money Concepts (SMC), AMD is a powerful way to understand why price often consolidates, makes a deceptive move, and then delivers the real directional move.


5
1. Accumulation — Build the Position
This is the phase where price usually moves sideways inside a range.
What you see:
* Equal highs / equal lows
* Tight consolidation
* Repeated support and resistance
* Liquidity building above and below the range
* No clear directional expansion
SMC interpretation: Large participants may be building positions while the market creates liquidity for the next move.
Think:
Range → Liquidity builds → Traders place stops
2. Manipulation — Take the Liquidity
This is the most important part of AMD.
Price temporarily moves outside the accumulation range, often taking obvious liquidity.
For example:
Bullish scenario:
Buy-side liquidity
─────────────────────────
↑
│ Manipulation
│ sweep
┌────────┴─────────┐
│ ACCUMULATION │
│ RANGE │
└──────────────────┘
↓
Sell-side liquidity
Price may:
1. Break below the range.
2. Trigger sell orders and stop losses.
3. Reach a liquidity pool.
4. Reject the area.
5. Reverse aggressively upward.
This is often called a liquidity sweep / stop hunt.
The key idea
Do not automatically trade the breakout.
A breakout can be the manipulation, not the real move.
3. Distribution — The Real Expansion
After liquidity has been taken, price can begin the actual directional move.
For a bullish AMD:
ACCUMULATION
↓
LIQUIDITY SWEEP
↓
MARKET STRUCTURE SHIFT
↓
DISPLACEMENT
↓
FVG / ORDER BLOCK
↓
DISTRIBUTION ↑↑↑
You want to see confirmation such as:
* Liquidity sweep
* Strong displacement
* MSS/BOS
* FVG formation
* Order-block reaction
* Continuation toward opposing liquidity
🔥 AMD + SMC Entry Model
A high-quality setup can look like this:
Step 1 — Identify the range
Mark:
* Range High
* Range Low
* Equal Highs
* Equal Lows
Step 2 — Identify liquidity
Ask:
Where are traders likely to put their stops?
Above:
* Previous highs
* Equal highs
* Session highs
Below:
* Previous lows
* Equal lows
* Session lows
Step 3 — Wait for manipulation
Don't enter simply because price reaches the liquidity.
Wait for a sweep.
Step 4 — Look for displacement
After the sweep, look for an aggressive candle sequence showing that order flow has changed.
Step 5 — Confirm MSS/BOS
For example:
Previous High
────────
│
│
/\ │
/ \____│
/ │
───┘ │
↓
Liquidity Sweep
↑
│
Strong move
↑
MSS / BOS
↑
Entry
Step 6 — Find the entry
Potential entry locations:
A. Fair Value Gap (FVG) Price retraces into the imbalance after displacement.
B. Order Block Price returns to the institutional-looking origin of the displacement.
C. Breaker A failed order block can become a breaker structure.
🧠 AMD Is Not Always Three Perfect Phases
This is extremely important.
AMD is a market behavior model, not a rigid pattern.
You won't always get:
Perfect accumulation → perfect manipulation → perfect distribution.
Sometimes:
* Manipulation happens very quickly.
* Accumulation lasts hours/days.
* Multiple liquidity sweeps occur.
* Distribution begins without a deep retracement.
* AMD occurs on one timeframe while another timeframe shows a completely different structure.
Therefore, context + liquidity + structure + displacement matter more than simply labeling candles as AMD.
Nota
#Warning: Investments in the securities market are subject to market risks. Read all the related documents carefully before investing.#Disclaimer: The information provided in this content is for educational and informational purposes only and should not be considered investment advice, financial advice, trading advice, or a recommendation to buy, sell, or hold any security, stock, derivative, cryptocurrency, or other financial instrument.
Stock market investments are subject to market risks, including the possible loss of part or all of your invested capital. Past performance does not guarantee future results.
Any examples, charts, technical analysis, Smart Money Concepts (SMC), price-action strategies, market views, or trading setups discussed are provided solely for educational purposes. They are not guarantees of future market performance.

Exención de responsabilidad
La información y las publicaciones no constituyen, ni deben considerarse como, asesoramiento o recomendaciones financieras, de inversión, de trading u otro tipo, proporcionadas o respaldadas por TradingView. Obtenga más información en Condiciones de uso.
Exención de responsabilidad
La información y las publicaciones no constituyen, ni deben considerarse como, asesoramiento o recomendaciones financieras, de inversión, de trading u otro tipo, proporcionadas o respaldadas por TradingView. Obtenga más información en Condiciones de uso.