
An interesting observation here...
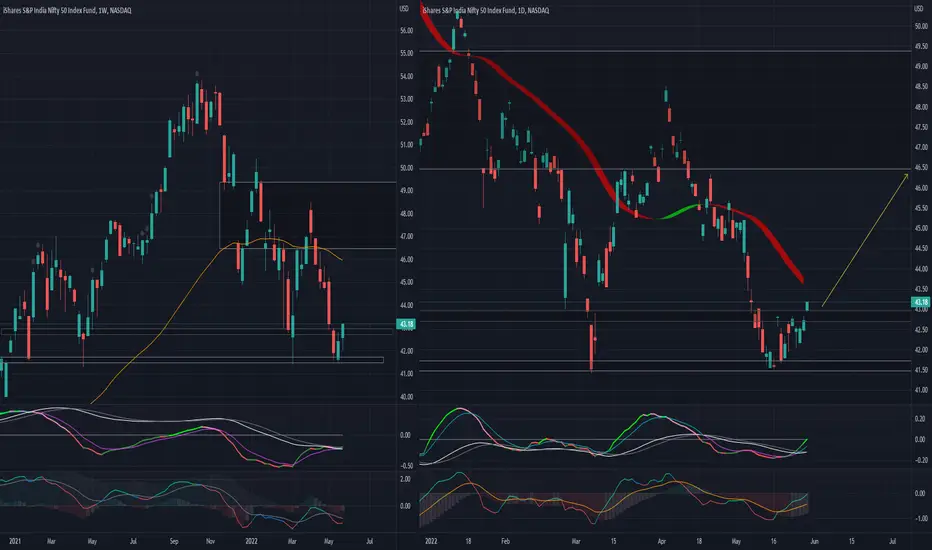
The weekly chart for INDY has recent bullish candlestick patterns after bouncing off a long term support level at 41.50. This is the second test in 2022, and the bounce closed above the next (gap) resistance level, above 43. The technical indicators are turning bullish, as RPM tuned up for a crossover.
The daily chart shows the past two weeks series of higher lows and higher highs and a gap up, marubozu-like candlestick. Technical indicators crossed over bullish, and are supportive of a test on the EMA band.
Taken together, there appears to be a 8-15% upside off this support bounce.
Interesting time juncture...
Stay well and stay safe!
The weekly chart for INDY has recent bullish candlestick patterns after bouncing off a long term support level at 41.50. This is the second test in 2022, and the bounce closed above the next (gap) resistance level, above 43. The technical indicators are turning bullish, as RPM tuned up for a crossover.
The daily chart shows the past two weeks series of higher lows and higher highs and a gap up, marubozu-like candlestick. Technical indicators crossed over bullish, and are supportive of a test on the EMA band.
Taken together, there appears to be a 8-15% upside off this support bounce.
Interesting time juncture...
Stay well and stay safe!

Exención de responsabilidad
La información y las publicaciones no constituyen, ni deben considerarse como, asesoramiento o recomendaciones financieras, de inversión, de trading u otro tipo, proporcionadas o respaldadas por TradingView. Obtenga más información en Condiciones de uso.
Exención de responsabilidad
La información y las publicaciones no constituyen, ni deben considerarse como, asesoramiento o recomendaciones financieras, de inversión, de trading u otro tipo, proporcionadas o respaldadas por TradingView. Obtenga más información en Condiciones de uso.