
20 JULY 2020
INSTRUMENT: INDIAN OIL CORPORATION.
TIMEFRAME: POSITIONAL.
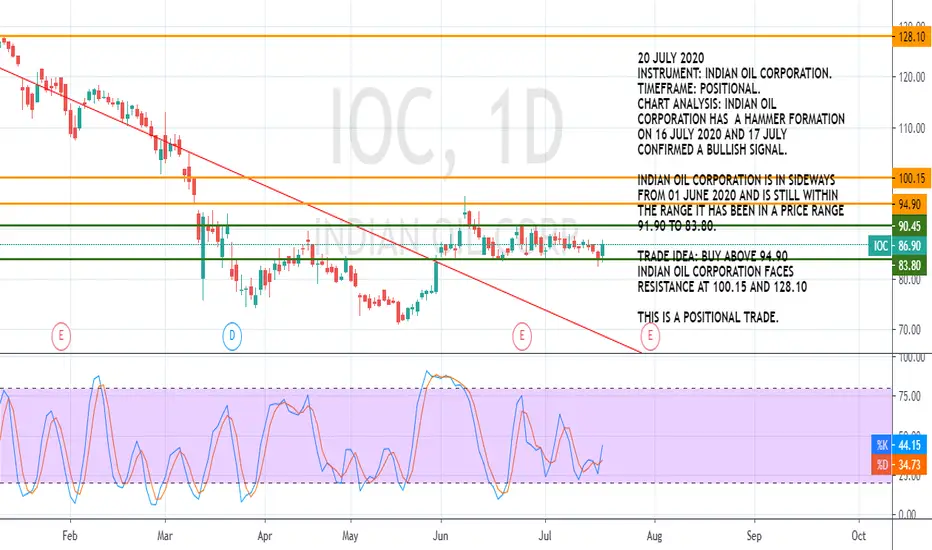
CHART ANALYSIS: INDIAN OIL CORPORATION HAS A HAMMER FORMATION ON 16 JULY 2020 AND 17 JULY CONFIRMED A BULLISH SIGNAL.
INDIAN OIL CORPORATION IS IN SIDEWAYS FROM 01 JUNE 2020 AND IS STILL WITHIN THE RANGE IT HAS BEEN IN A PRICE RANGE 91.90 TO 83.80.
TRADE IDEA: BUY ABOVE 94.90
INDIAN OIL CORPORATION FACES RESISTANCE AT 100.15 AND 128.10
THIS IS A POSITIONAL TRADE.
RISK DISCLOSURE:
Technical analysis of FOREX and INDIAN MARKETS. We are not SEBI REGISTERED ANALYSTS The views expressed here are for our record purposes only. Please consult your personal financial advisor before investing. We are in no way responsible for your profits/losses what so ever.
INSTRUMENT: INDIAN OIL CORPORATION.
TIMEFRAME: POSITIONAL.
CHART ANALYSIS: INDIAN OIL CORPORATION HAS A HAMMER FORMATION ON 16 JULY 2020 AND 17 JULY CONFIRMED A BULLISH SIGNAL.
INDIAN OIL CORPORATION IS IN SIDEWAYS FROM 01 JUNE 2020 AND IS STILL WITHIN THE RANGE IT HAS BEEN IN A PRICE RANGE 91.90 TO 83.80.
TRADE IDEA: BUY ABOVE 94.90
INDIAN OIL CORPORATION FACES RESISTANCE AT 100.15 AND 128.10
THIS IS A POSITIONAL TRADE.
RISK DISCLOSURE:
Technical analysis of FOREX and INDIAN MARKETS. We are not SEBI REGISTERED ANALYSTS The views expressed here are for our record purposes only. Please consult your personal financial advisor before investing. We are in no way responsible for your profits/losses what so ever.

Exención de responsabilidad
La información y las publicaciones no constituyen, ni deben considerarse como, asesoramiento o recomendaciones financieras, de inversión, de trading u otro tipo, proporcionadas o respaldadas por TradingView. Obtenga más información en Condiciones de uso.
Exención de responsabilidad
La información y las publicaciones no constituyen, ni deben considerarse como, asesoramiento o recomendaciones financieras, de inversión, de trading u otro tipo, proporcionadas o respaldadas por TradingView. Obtenga más información en Condiciones de uso.