
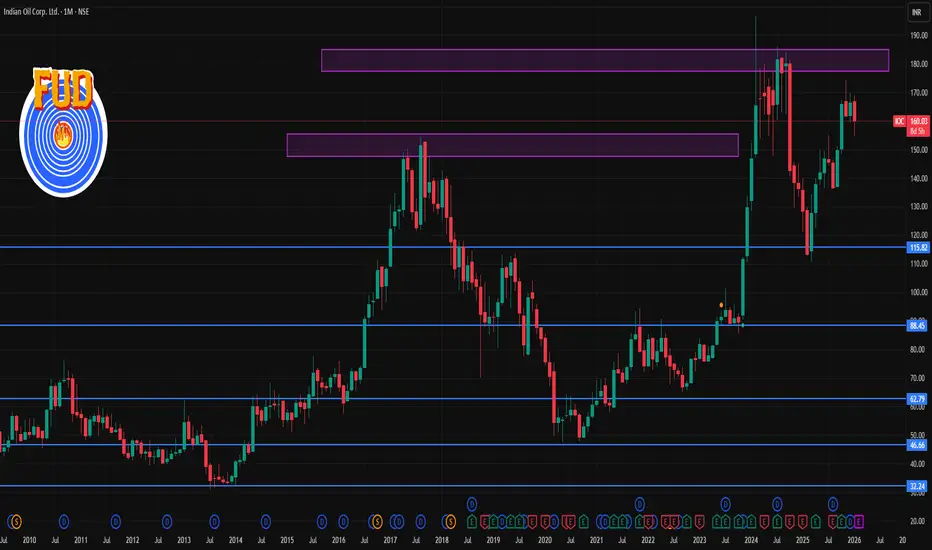
📌 CURRENT PRICE (as of 22 Jan 2026)
IOC share price: ~₹159.9 per share (NSE/BSE).
📊 1‑Month Technical Levels (Current & Accurate)
Resistance (Upside Levels)
These are levels where price may find selling pressure in the near term:
R1 – Immediate Resistance: ~₹160.6–₹162.5
R2 – Mid Resistance: ~₹162.5–₹163.9
R3 – Higher Resistance: ~₹164–₹165.2
A broader longer‑range resistance zone near ₹170–₹171+ remains significant if the market strengthens.
Why these matter:
Resistance levels show where the stock has historically paused or reversed on recent charts — useful for targets or exits.
Support (Downside Levels)
These are key near‑term supporting price zones:
S1 – Immediate Support: ~₹156.8–₹159.4
S2 – Secondary Support: ~₹154.7–₹157.9
S3 – Deeper Support: ~₹152.9–₹155.0
Note: If price breaks below ~₹155, it could signal further weakness in the short term.
🧠 How to Use These Levels
Swing traders: Use support zones for entry zones and resistance levels as targets.
Breakouts: A clear close above ₹164–₹165 could open room toward the ₹170+ zone.
Breakdown: A close below ₹155 could escalate selling into deeper support.

Contact Knowledgehub for a detailed consultation: Dm on WhatsApp: [wa.link/a2o0kz]-
Phone No: [+91 93102 26243]-
Email: [tradingviewknowledgehub@gmail.com]---
-- Let’s achieve success together!
Phone No: [+91 93102 26243]-
Email: [tradingviewknowledgehub@gmail.com]---
-- Let’s achieve success together!
Publicaciones relacionadas
Exención de responsabilidad
La información y las publicaciones no constituyen, ni deben considerarse como, asesoramiento o recomendaciones financieras, de inversión, de trading u otro tipo, proporcionadas o respaldadas por TradingView. Obtenga más información en Condiciones de uso.