
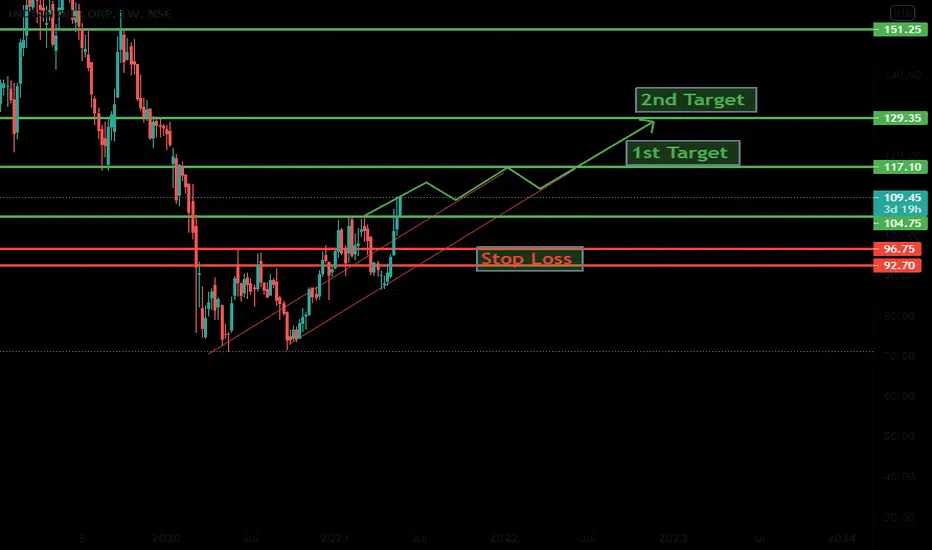
Price action in IOC shows price breaking out on Weakly chart. Price also closed above its 20 periods moving average and RSI shows a break out of a falling trendline and a pop above 70. This shows the stock is gaining momentum on the upside.
Buy around Rs 104-109 for a rally to Rs 118 and above that to Rs 130 over the next 2-3 weeks. Keep a stop below Rs 95.
Buy around Rs 104-109 for a rally to Rs 118 and above that to Rs 130 over the next 2-3 weeks. Keep a stop below Rs 95.
Operación activa
1st Target Hit
Exención de responsabilidad
La información y las publicaciones no constituyen, ni deben considerarse como, asesoramiento o recomendaciones financieras, de inversión, de trading u otro tipo, proporcionadas o respaldadas por TradingView. Obtenga más información en Condiciones de uso.
Exención de responsabilidad
La información y las publicaciones no constituyen, ni deben considerarse como, asesoramiento o recomendaciones financieras, de inversión, de trading u otro tipo, proporcionadas o respaldadas por TradingView. Obtenga más información en Condiciones de uso.