
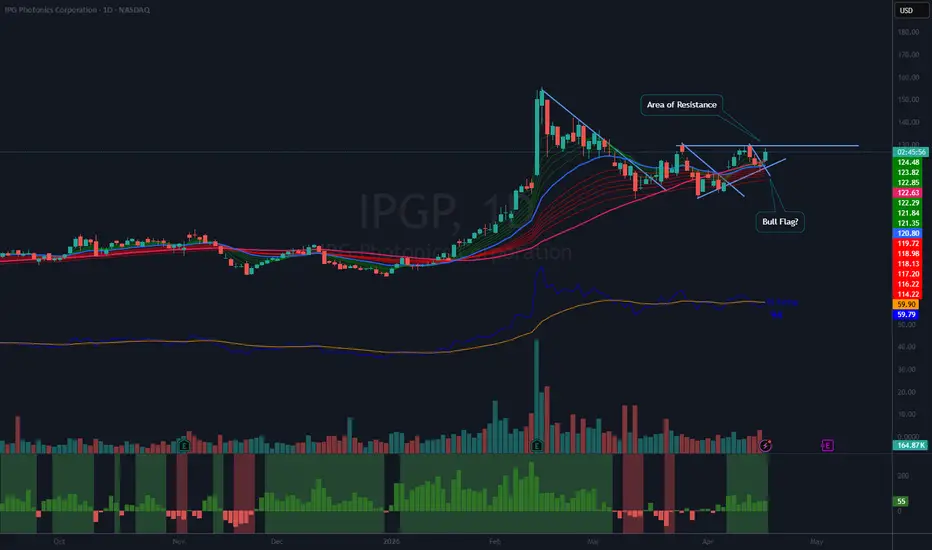
Overview of IPGP Volatility Contraction Pattern (VCP)
IPG Photonics operates within the dynamic optical components sector, supplying lasers, optics, and robotic automation equipment. These products are essential for constructing the hardware required for artificial intelligence centers.
Stock Performance and Technical Analysis
I have been monitoring this stock for some time. It has demonstrated relative strength during the recent market downturn, as evidenced by its ability to maintain its lows and consolidate within a Volatility Contraction Pattern (VCP), a strategy popularized by Mark Minervini.
Position Entry and Strategy
Today, I initiated a quarter-sized position as the stock broke above what appears to be a bull flag. My plan is to gradually increase this position to a full allocation over the next few days, provided the stock can move above the horizontal resistance area. It is important to note that earnings are scheduled in 18 days, which allows sufficient time for a potential rally ahead of the event. For risk management, I will set a stop on the current position if there is a decisive close below the 21-day exponential moving average (EMA), indicated by the blue line on the chart.
Disclaimer
If you are interested in this trading idea, please adapt it to your own trading and investing rules. This is not investment or trading advice.
IPG Photonics operates within the dynamic optical components sector, supplying lasers, optics, and robotic automation equipment. These products are essential for constructing the hardware required for artificial intelligence centers.
Stock Performance and Technical Analysis
I have been monitoring this stock for some time. It has demonstrated relative strength during the recent market downturn, as evidenced by its ability to maintain its lows and consolidate within a Volatility Contraction Pattern (VCP), a strategy popularized by Mark Minervini.
Position Entry and Strategy
Today, I initiated a quarter-sized position as the stock broke above what appears to be a bull flag. My plan is to gradually increase this position to a full allocation over the next few days, provided the stock can move above the horizontal resistance area. It is important to note that earnings are scheduled in 18 days, which allows sufficient time for a potential rally ahead of the event. For risk management, I will set a stop on the current position if there is a decisive close below the 21-day exponential moving average (EMA), indicated by the blue line on the chart.
Disclaimer
If you are interested in this trading idea, please adapt it to your own trading and investing rules. This is not investment or trading advice.

Ideas I publish are my own. They are not meant to be investment / trading advice. You are encouraged to do your own due diligence.
I am under no obligation to post any action or update to any idea.
Follow me on "X" where I post more content.
I am under no obligation to post any action or update to any idea.
Follow me on "X" where I post more content.
Exención de responsabilidad
La información y las publicaciones no constituyen, ni deben considerarse como, asesoramiento o recomendaciones financieras, de inversión, de trading u otro tipo, proporcionadas o respaldadas por TradingView. Obtenga más información en Condiciones de uso.
Ideas I publish are my own. They are not meant to be investment / trading advice. You are encouraged to do your own due diligence.
I am under no obligation to post any action or update to any idea.
Follow me on "X" where I post more content.
I am under no obligation to post any action or update to any idea.
Follow me on "X" where I post more content.
Exención de responsabilidad
La información y las publicaciones no constituyen, ni deben considerarse como, asesoramiento o recomendaciones financieras, de inversión, de trading u otro tipo, proporcionadas o respaldadas por TradingView. Obtenga más información en Condiciones de uso.