
Good evening?
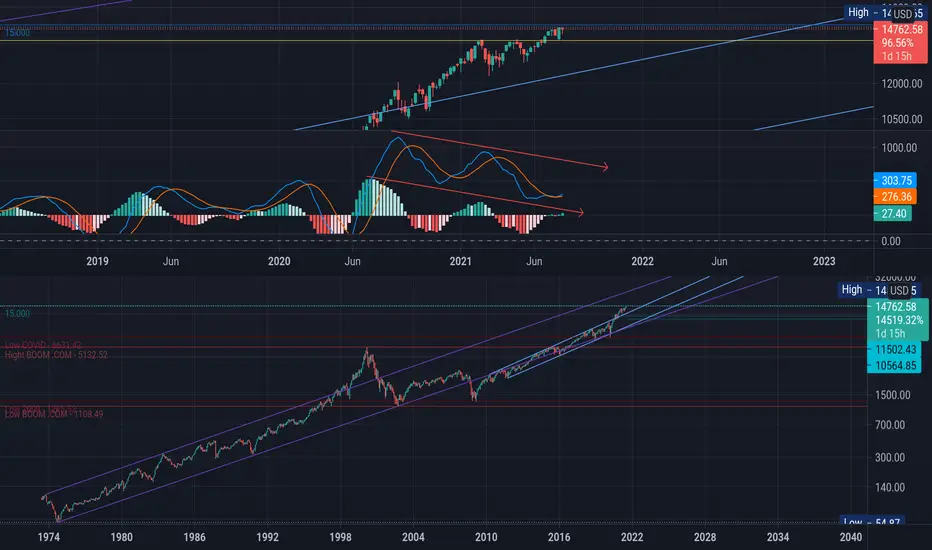
Signals to sell NASDAQ in general and BigTech shares in particular:
1. Round price of $ 15,000 = resistance.
2. Strong bearish MACD divergence on the weekly chart.
3. Beginning of bearish MACD divergence on slower monthly chart.
4. Bull trap - upward breakout of the resistance of the double top (yellow line).
Therefore, we can expect a Fibonacci correction from 30-50% to the $ 11.5k-10.5k range.
Not a financial recommendation.
GET RICH OR DIE TRYIN.
Signals to sell NASDAQ in general and BigTech shares in particular:
1. Round price of $ 15,000 = resistance.
2. Strong bearish MACD divergence on the weekly chart.
3. Beginning of bearish MACD divergence on slower monthly chart.
4. Bull trap - upward breakout of the resistance of the double top (yellow line).
Therefore, we can expect a Fibonacci correction from 30-50% to the $ 11.5k-10.5k range.
Not a financial recommendation.
GET RICH OR DIE TRYIN.

Exención de responsabilidad
La información y las publicaciones no constituyen, ni deben considerarse como, asesoramiento o recomendaciones financieras, de inversión, de trading u otro tipo, proporcionadas o respaldadas por TradingView. Obtenga más información en Condiciones de uso.
Exención de responsabilidad
La información y las publicaciones no constituyen, ni deben considerarse como, asesoramiento o recomendaciones financieras, de inversión, de trading u otro tipo, proporcionadas o respaldadas por TradingView. Obtenga más información en Condiciones de uso.