
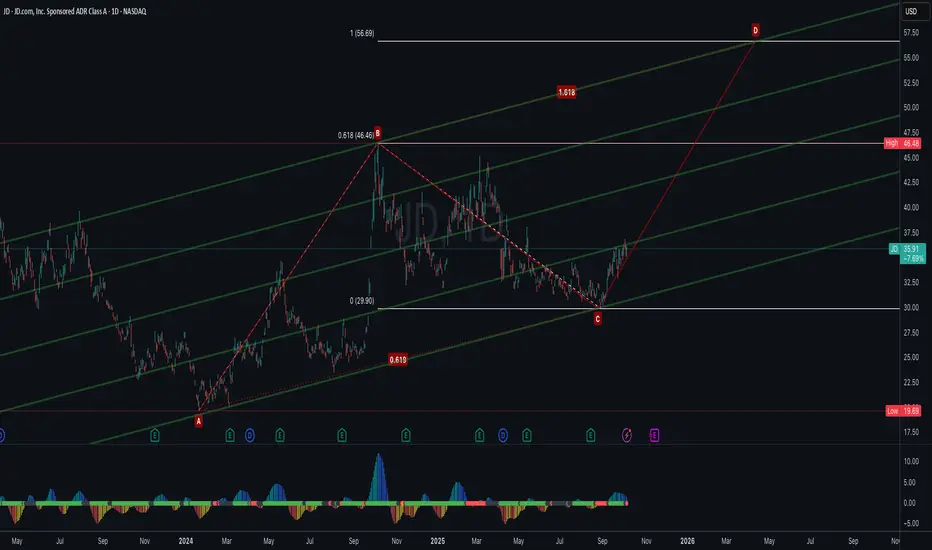
JD.com (JD) is forming a bullish ABCD harmonic pattern, with the current price advancing from point C toward the projected D completion zone. Based on the Fibonacci measurements, the AB=CD projection and 1.618 extension align near $56–57, suggesting a strong potential target area and confluence with the upper channel resistance.
A sustained move above $46.5 (B point) would confirm the continuation toward the D leg target. Momentum indicators are gradually turning positive, supporting the bullish bias in this setup.
Invalidation:
If price reverses and breaks below the C point, the ABCD harmonic structure would be invalidated, signaling potential weakness or a deeper retracement.
A sustained move above $46.5 (B point) would confirm the continuation toward the D leg target. Momentum indicators are gradually turning positive, supporting the bullish bias in this setup.
Invalidation:
If price reverses and breaks below the C point, the ABCD harmonic structure would be invalidated, signaling potential weakness or a deeper retracement.

Exención de responsabilidad
La información y las publicaciones no constituyen, ni deben considerarse como, asesoramiento o recomendaciones financieras, de inversión, de trading u otro tipo, proporcionadas o respaldadas por TradingView. Obtenga más información en Condiciones de uso.
Exención de responsabilidad
La información y las publicaciones no constituyen, ni deben considerarse como, asesoramiento o recomendaciones financieras, de inversión, de trading u otro tipo, proporcionadas o respaldadas por TradingView. Obtenga más información en Condiciones de uso.