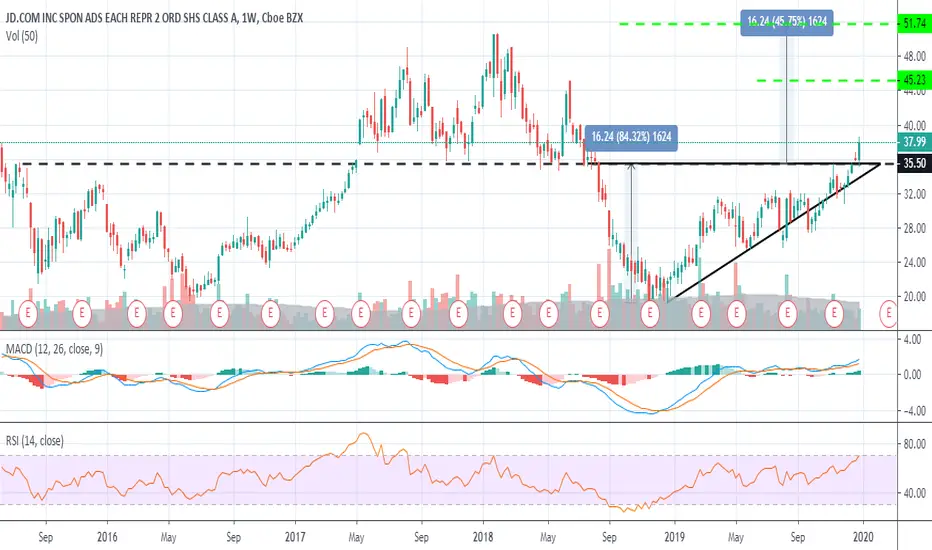
 JD stock price has traded around the 35.50 level for the past 5 years (dotted black line) and this level has been resistance from 2015-16 to support between 2017-2018 and then resistance again since mid 2018
After last support break the stock price drifted lower until it bottomed around 19.20 levels after the DEC'18 selloff
Since then the price has formed a nice ascending triangle from which has broken out in late DEC'19 after the announcement of Phase1 Deal between US and China
Volume is not yet what I would like it to be, but MACD and RSI have both sustained the move up
Targets are:
T1 - former JUN'18 high before the last leg down at 45.23
T2 - measured move from the triangle breakout at 51.74
Good luck,
TA
Operación cerrada: objetivo alcanzado
Both targets have been reachedCongrats longs,
TA

Exención de responsabilidad
La información y las publicaciones no constituyen, ni deben considerarse como, asesoramiento o recomendaciones financieras, de inversión, de trading u otro tipo, proporcionadas o respaldadas por TradingView. Obtenga más información en Condiciones de uso.
Exención de responsabilidad
La información y las publicaciones no constituyen, ni deben considerarse como, asesoramiento o recomendaciones financieras, de inversión, de trading u otro tipo, proporcionadas o respaldadas por TradingView. Obtenga más información en Condiciones de uso.