
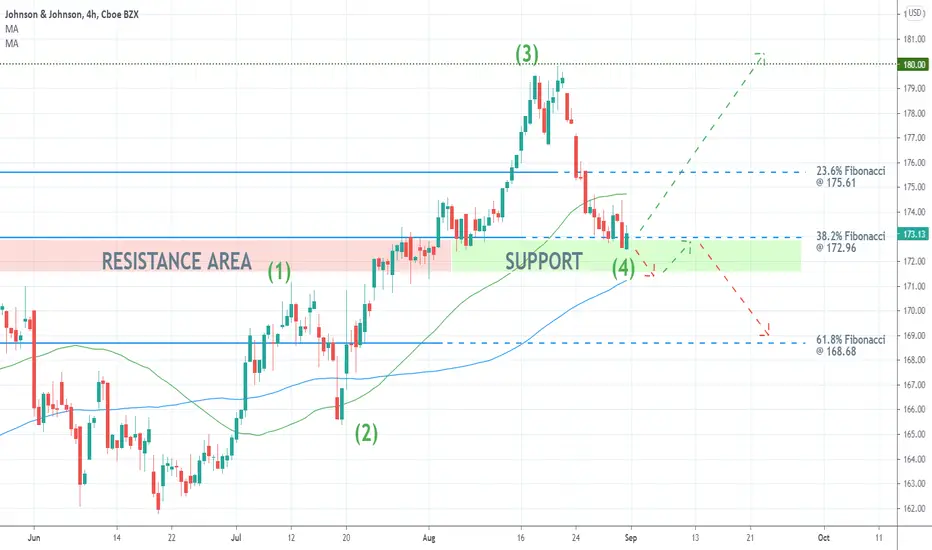
The share price of Johnson and Johnson looks ready to rebound from the major resistance-turned-support area, underpinned by the 23.6 per cent Fibonacci retracement level at 175.61, and resume climbing.
The underlying uptrend appears to be taking the form of a 1-5 impulse wave pattern, as postulated by the Elliott Wave Theory. Thus, the recent correction can be perceived as the second retracement leg (3-4). If the price action strengthens above the 23.6 per cent Fibonacci, this would allow for the subsequent emergence of the final impulse leg (4-5).
If, however, the correction breaks down below the lower limit of the support, underpinned by the 100-day MA (in blue), this would likely mean that it could then be extended lower towards the 38.2 per cent Fibonacci.
The underlying uptrend appears to be taking the form of a 1-5 impulse wave pattern, as postulated by the Elliott Wave Theory. Thus, the recent correction can be perceived as the second retracement leg (3-4). If the price action strengthens above the 23.6 per cent Fibonacci, this would allow for the subsequent emergence of the final impulse leg (4-5).
If, however, the correction breaks down below the lower limit of the support, underpinned by the 100-day MA (in blue), this would likely mean that it could then be extended lower towards the 38.2 per cent Fibonacci.

Exención de responsabilidad
La información y las publicaciones no constituyen, ni deben considerarse como, asesoramiento o recomendaciones financieras, de inversión, de trading u otro tipo, proporcionadas o respaldadas por TradingView. Obtenga más información en Condiciones de uso.
Exención de responsabilidad
La información y las publicaciones no constituyen, ni deben considerarse como, asesoramiento o recomendaciones financieras, de inversión, de trading u otro tipo, proporcionadas o respaldadas por TradingView. Obtenga más información en Condiciones de uso.