Largo
Trending Kellog
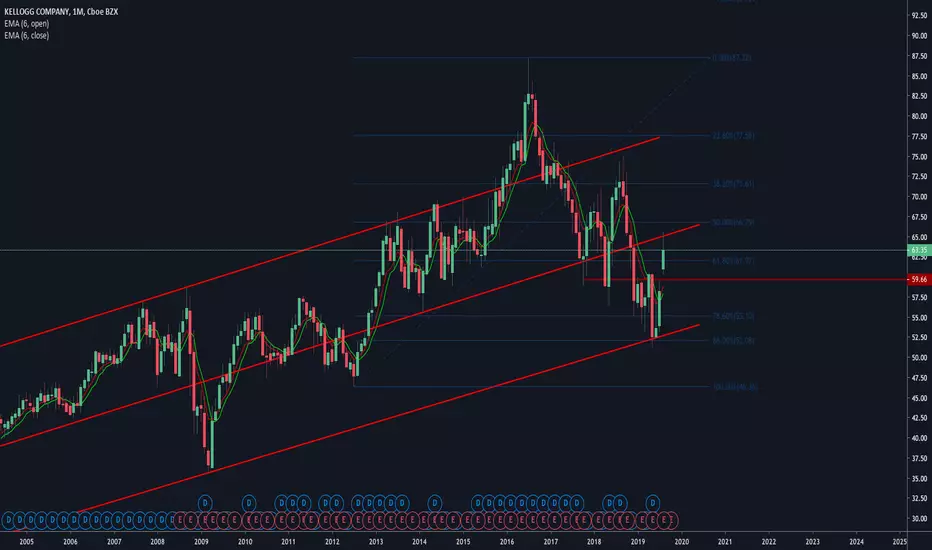
Chart Analysis
It's a bit late, but we see on weekly and monthly chart that $NYSE:K made a nice turn on long term trendline.
Last week the chart formed a nice low around the Fibonacci 78.6.
Of course, we missed the low, but maybe we get a second chance around 60$ to enter.
Dividend
3.6% dividend
Payout ratio 58%
14 years Dividend Growth
It's a bit late, but we see on weekly and monthly chart that $NYSE:K made a nice turn on long term trendline.
Last week the chart formed a nice low around the Fibonacci 78.6.
Of course, we missed the low, but maybe we get a second chance around 60$ to enter.
Dividend
3.6% dividend
Payout ratio 58%
14 years Dividend Growth

Exención de responsabilidad
La información y las publicaciones no constituyen, ni deben considerarse como, asesoramiento o recomendaciones financieras, de inversión, de trading u otro tipo, proporcionadas o respaldadas por TradingView. Obtenga más información en Condiciones de uso.
Exención de responsabilidad
La información y las publicaciones no constituyen, ni deben considerarse como, asesoramiento o recomendaciones financieras, de inversión, de trading u otro tipo, proporcionadas o respaldadas por TradingView. Obtenga más información en Condiciones de uso.