An Uptrend Pattern!
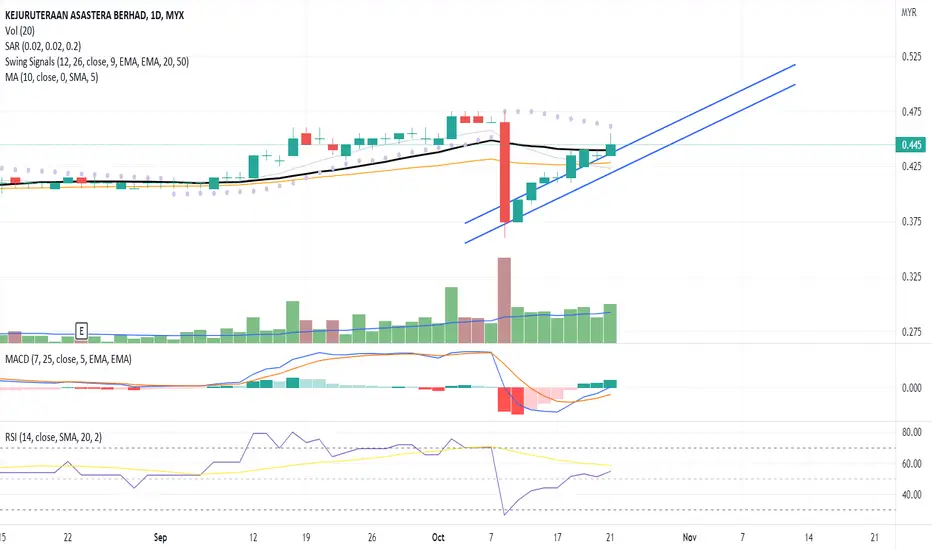
The candlestick pattern indicates a continuous price uptrend towards the MA20 line backed with high volume.
Precaution because the last candlestick indicates a "shooting star" candle, hence, the probability of price correction between the trendline channel or potential resistance area around the price range of the candle.
The MACD confirms the price uptrend towards the next price resistance.
The RSI indicates a fresh buying interest in the stock.
Let's put KAB in WL and watch out for continuous price movement toward the next price resistance backed with volume.
R 0.470
S 0.425
Precaution because the last candlestick indicates a "shooting star" candle, hence, the probability of price correction between the trendline channel or potential resistance area around the price range of the candle.
The MACD confirms the price uptrend towards the next price resistance.
The RSI indicates a fresh buying interest in the stock.
Let's put KAB in WL and watch out for continuous price movement toward the next price resistance backed with volume.
R 0.470
S 0.425

Exención de responsabilidad
La información y las publicaciones no constituyen, ni deben considerarse como, asesoramiento o recomendaciones financieras, de inversión, de trading u otro tipo, proporcionadas o respaldadas por TradingView. Obtenga más información en Condiciones de uso.
Exención de responsabilidad
La información y las publicaciones no constituyen, ni deben considerarse como, asesoramiento o recomendaciones financieras, de inversión, de trading u otro tipo, proporcionadas o respaldadas por TradingView. Obtenga más información en Condiciones de uso.