
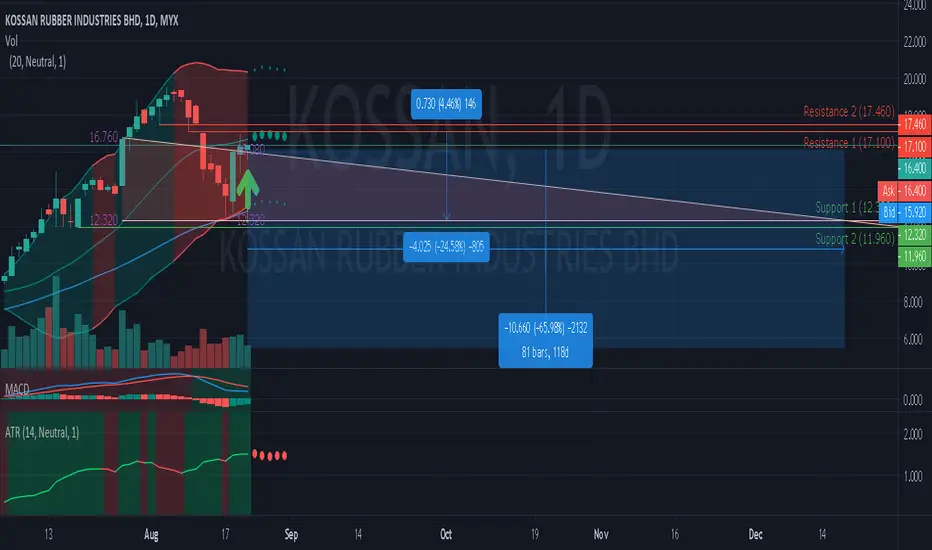
The support and resistance level of Kossan are 12.32 and 17.1 respectively.
It is observed that the MACD line of KOSSAN is above the centreline indicating some degree of strength in the price movement.
Resistance 1 : 17.1 (4.46%)
Resistance 2 : 17.46
Support 1 : 12.32 (-24.58%)
Support 2 : 11.96
Descending Triangle prediction at 21 Aug 2020.
Possible bearish price movement towards the resistance 12.32 within the next 118 days (81 bars : ETA 16 Dec 2020).
It is observed that the MACD line of KOSSAN is above the centreline indicating some degree of strength in the price movement.
Resistance 1 : 17.1 (4.46%)
Resistance 2 : 17.46
Support 1 : 12.32 (-24.58%)
Support 2 : 11.96
Descending Triangle prediction at 21 Aug 2020.
Possible bearish price movement towards the resistance 12.32 within the next 118 days (81 bars : ETA 16 Dec 2020).

Exención de responsabilidad
La información y las publicaciones no constituyen, ni deben considerarse como, asesoramiento o recomendaciones financieras, de inversión, de trading u otro tipo, proporcionadas o respaldadas por TradingView. Obtenga más información en Condiciones de uso.
Exención de responsabilidad
La información y las publicaciones no constituyen, ni deben considerarse como, asesoramiento o recomendaciones financieras, de inversión, de trading u otro tipo, proporcionadas o respaldadas por TradingView. Obtenga más información en Condiciones de uso.