
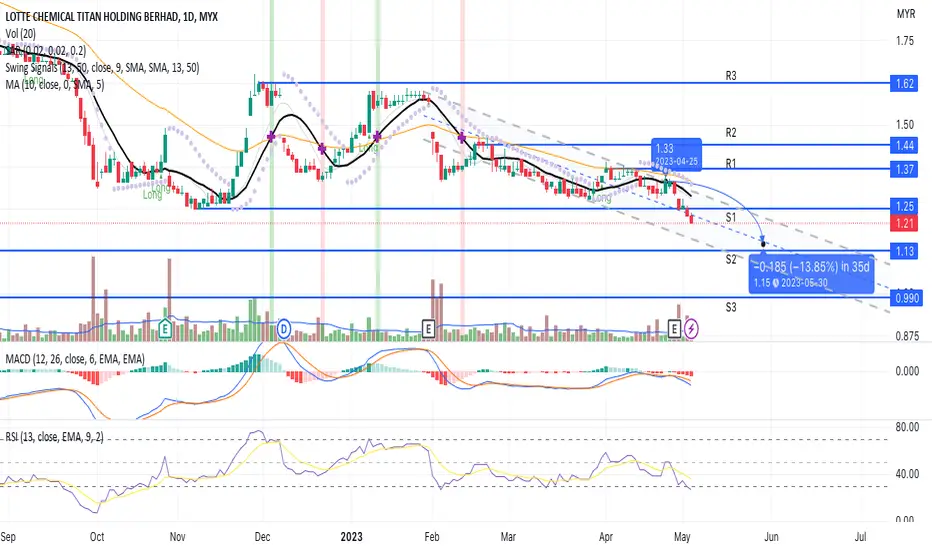
The candlestick signs a weak demand. Hence, a downtrend pattern emerged where the price closed below the S1 line due to a price being pushed down by a strong Bearish pressure. A strong counterattack of Bullish pressure is required to break the decline. As a result, when "Smart Money" is in need to break a strong decline, they have to put a lot of buying pressure and strong volume surge.
MACD and RSI confirm the price downtrend pattern.
The S2 line will be the next low price if the price steadily declines due to weak demand from the buyer.
Let's save LCTITAN in WL for the possibility of a reversal up signal could be expected.
S1 1.25, S2 1.10, S3 1.00
MACD and RSI confirm the price downtrend pattern.
The S2 line will be the next low price if the price steadily declines due to weak demand from the buyer.
Let's save LCTITAN in WL for the possibility of a reversal up signal could be expected.
S1 1.25, S2 1.10, S3 1.00

Exención de responsabilidad
La información y las publicaciones no constituyen, ni deben considerarse como, asesoramiento o recomendaciones financieras, de inversión, de trading u otro tipo, proporcionadas o respaldadas por TradingView. Obtenga más información en Condiciones de uso.
Exención de responsabilidad
La información y las publicaciones no constituyen, ni deben considerarse como, asesoramiento o recomendaciones financieras, de inversión, de trading u otro tipo, proporcionadas o respaldadas por TradingView. Obtenga más información en Condiciones de uso.