
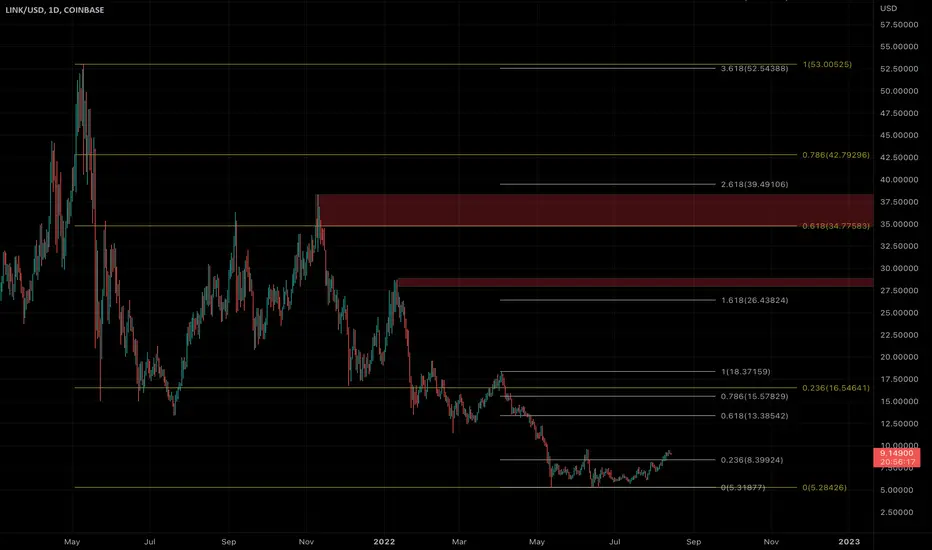
Yellow fib drawn on the weekly time frame. This is the long time frame expected targets.
White fib drawn on the daily time frame. This gives us guidance for the short term targets and possible rejection/volatile levels.
Red boxes are drawn on the daily time frame where wicks are expected to fill during the next pump.
Let me know what you think.
White fib drawn on the daily time frame. This gives us guidance for the short term targets and possible rejection/volatile levels.
Red boxes are drawn on the daily time frame where wicks are expected to fill during the next pump.
Let me know what you think.

Exención de responsabilidad
La información y las publicaciones no constituyen, ni deben considerarse como, asesoramiento o recomendaciones financieras, de inversión, de trading u otro tipo, proporcionadas o respaldadas por TradingView. Obtenga más información en Condiciones de uso.
Exención de responsabilidad
La información y las publicaciones no constituyen, ni deben considerarse como, asesoramiento o recomendaciones financieras, de inversión, de trading u otro tipo, proporcionadas o respaldadas por TradingView. Obtenga más información en Condiciones de uso.