
#LINK
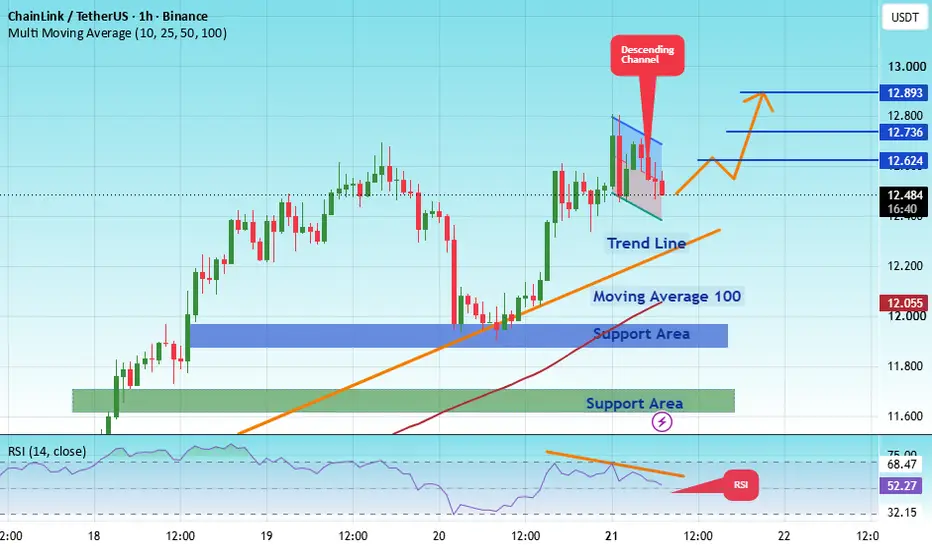
The price is moving within a bearish channel on the 1-hour timeframe; it has reached the lower boundary and appears poised for a rebound, suggesting a potential upward move upon retesting this level.
The Relative Strength Index (RSI) indicates a bearish trend, but an upward breakout is likely due to oversold conditions on the 1-hour chart.
An orange trend line supports the potential upward rebound.
There is initial support at 11.89, acting as a primary support zone.
A key support zone (marked in green) exists at 11.60; the price has rebounded from this area multiple times, making it a strong support level.
The price is moving toward the 100-period moving average—a level we are currently approaching—which supports the bullish outlook.
Entry Price: 12.50
Target 1: 12.62
Target 2: 12.73
Target 3: 12.89
Stop Loss: At the green resistance zone.
Remember this simple rule: Capital management.
If you have any questions, please leave a comment.
Thank you.
Operación cerrada: objetivo alcanzado
#LINK
Target 1: 12.62 Reached
Target 2: 12.73 Reached
Target 3: 12.89 Reached

📍Trade Smart & Stay Protected⭐️
Join Our Telegram Channel Signals Futures and Spot Free
👉 t.me/+WN4RexVn8DM2MTlk
📌 We're open to Promotions, Ads & Partnerships
Join Our Telegram Channel Signals Futures and Spot Free
👉 t.me/+WN4RexVn8DM2MTlk
📌 We're open to Promotions, Ads & Partnerships
Exención de responsabilidad
La información y las publicaciones no constituyen, ni deben considerarse como, asesoramiento o recomendaciones financieras, de inversión, de trading u otro tipo, proporcionadas o respaldadas por TradingView. Obtenga más información en Condiciones de uso.