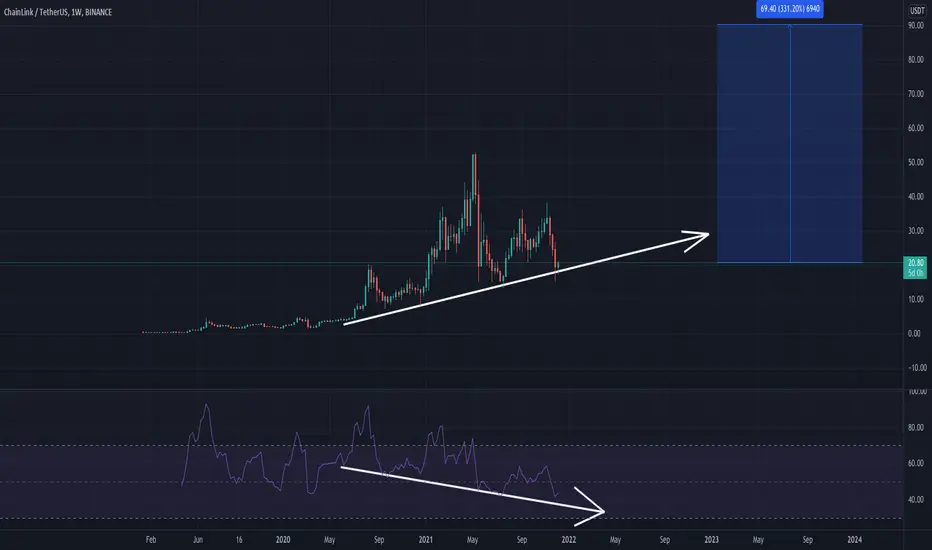

 LINKUSDT is a monster in disguise, with a huge surprise waiting around the corner.
 On the weekly timeframe chart, we can see a monster-sized hidden bullish divergence. The price action has been printing higher lows, while the RSI has been printing lower lows. By definition, this is a hidden bullish divergence. Something like this appearing on a high time frame, in our example the 1-Week time frame, can only mean one thing: a huge move on the upside is waiting for us.
Fundamentally,
LINKUSDT is also a fantastic project, having just partnered up with the former GOOGLE CEO - Eric Schmidt. I have never been so excited for a project before! Good luck,
Your Ganbu
⚠️ Let me know your feedback and comments below!
⚠️ Follow me if you would like to see more analysis like this

Exención de responsabilidad
La información y las publicaciones no constituyen, ni deben considerarse como, asesoramiento o recomendaciones financieras, de inversión, de trading u otro tipo, proporcionadas o respaldadas por TradingView. Obtenga más información en Condiciones de uso.
Exención de responsabilidad
La información y las publicaciones no constituyen, ni deben considerarse como, asesoramiento o recomendaciones financieras, de inversión, de trading u otro tipo, proporcionadas o respaldadas por TradingView. Obtenga más información en Condiciones de uso.