
A) The Liquidity & Risk Regime
Before looking at the candles, we must acknowledge the current Tier 1 & Tier 2 macro backdrop:
• DXY & Yields:
The U.S. Dollar Index (DXY) is showing a structural cooling, which historically expands global liquidity. With US10Y real yields stabilizing, the opportunity cost of holding high-utility altcoins like LINK is decreasing.
• TGA & RRP Flow:
Recent drains in the Reverse Repo (RRP) facility suggest liquidity is rotating back into risk assets. This “hidden liquidity” remains a key driver behind the current market expansion.
---
B) Volume Footprint & Order Flow
We observe clear institutional behavior around key levels:
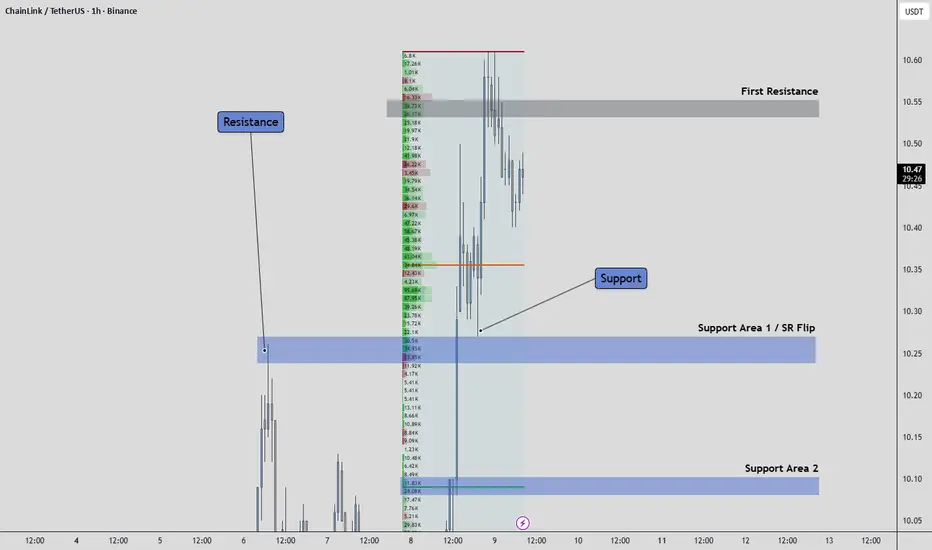
• Absorption at Support Area 1 ($10.25):
As price dipped into this zone, the volume footprint showed heavy passive buying. Large limit orders absorbed sell pressure, preventing breakdown. This is a classic institutional absorption signature.
• CVD Divergence:
While price consolidated at Support Area 1, aggressive market selling failed to push price lower. This divergence confirms that strong hands are absorbing weak hands supply.
• SR Flip Confirmation:
The transition of Support Area 1 from resistance to support is validated by the high-volume node at this level. This represents a structural liquidity wall, not a simple technical line.
---
C) Execution & Entry Strategy
• Entry Style:
Look for a “test and rejection” of the $10.35 mid-line. The ideal setup is a low-volume retracement followed by an aggressive delta spike (buy market orders) confirming continuation.
• First Target:
$10.55 — This area aligns with a low-volume node where price is likely to move rapidly due to reduced liquidity friction.
• Invalidation:
A 1H candle close below $10.10 (Support Area 2) invalidates the bullish micro-structure. This would suggest a temporary break in liquidity conditions, potentially driven by risk-off macro shocks or volatility expansion.
---
Macro-Technical Correlation Table
• Global M2: Expanding → Bullish (structural liquidity tailwind)
• VIX (Fear): Subdued (<15) → Risk-on environment supports continuation
• Footprint Delta: Positive → Confirms aggressive buying pressure
• ETF Flows: Net positive → Institutional confirmation of demand
---
Easy-to-Understand Relation: The "Vacuum" Effect
When the DXY (Dollar) declines, it effectively reduces the “gravity” in global markets. Risk assets like LINK become easier to lift as liquidity expands.
The volume footprint acts like a map of institutional positioning — showing exactly where large players defended price ($10.25 zone). This removes guesswork and replaces it with observable order flow behavior.
Before looking at the candles, we must acknowledge the current Tier 1 & Tier 2 macro backdrop:
• DXY & Yields:
The U.S. Dollar Index (DXY) is showing a structural cooling, which historically expands global liquidity. With US10Y real yields stabilizing, the opportunity cost of holding high-utility altcoins like LINK is decreasing.
• TGA & RRP Flow:
Recent drains in the Reverse Repo (RRP) facility suggest liquidity is rotating back into risk assets. This “hidden liquidity” remains a key driver behind the current market expansion.
---
B) Volume Footprint & Order Flow
We observe clear institutional behavior around key levels:
• Absorption at Support Area 1 ($10.25):
As price dipped into this zone, the volume footprint showed heavy passive buying. Large limit orders absorbed sell pressure, preventing breakdown. This is a classic institutional absorption signature.
• CVD Divergence:
While price consolidated at Support Area 1, aggressive market selling failed to push price lower. This divergence confirms that strong hands are absorbing weak hands supply.
• SR Flip Confirmation:
The transition of Support Area 1 from resistance to support is validated by the high-volume node at this level. This represents a structural liquidity wall, not a simple technical line.
---
C) Execution & Entry Strategy
• Entry Style:
Look for a “test and rejection” of the $10.35 mid-line. The ideal setup is a low-volume retracement followed by an aggressive delta spike (buy market orders) confirming continuation.
• First Target:
$10.55 — This area aligns with a low-volume node where price is likely to move rapidly due to reduced liquidity friction.
• Invalidation:
A 1H candle close below $10.10 (Support Area 2) invalidates the bullish micro-structure. This would suggest a temporary break in liquidity conditions, potentially driven by risk-off macro shocks or volatility expansion.
---
Macro-Technical Correlation Table
• Global M2: Expanding → Bullish (structural liquidity tailwind)
• VIX (Fear): Subdued (<15) → Risk-on environment supports continuation
• Footprint Delta: Positive → Confirms aggressive buying pressure
• ETF Flows: Net positive → Institutional confirmation of demand
---
Easy-to-Understand Relation: The "Vacuum" Effect
When the DXY (Dollar) declines, it effectively reduces the “gravity” in global markets. Risk assets like LINK become easier to lift as liquidity expands.
The volume footprint acts like a map of institutional positioning — showing exactly where large players defended price ($10.25 zone). This removes guesswork and replaces it with observable order flow behavior.

Exención de responsabilidad
La información y las publicaciones no constituyen, ni deben considerarse como, asesoramiento o recomendaciones financieras, de inversión, de trading u otro tipo, proporcionadas o respaldadas por TradingView. Obtenga más información en Condiciones de uso.
Exención de responsabilidad
La información y las publicaciones no constituyen, ni deben considerarse como, asesoramiento o recomendaciones financieras, de inversión, de trading u otro tipo, proporcionadas o respaldadas por TradingView. Obtenga más información en Condiciones de uso.