
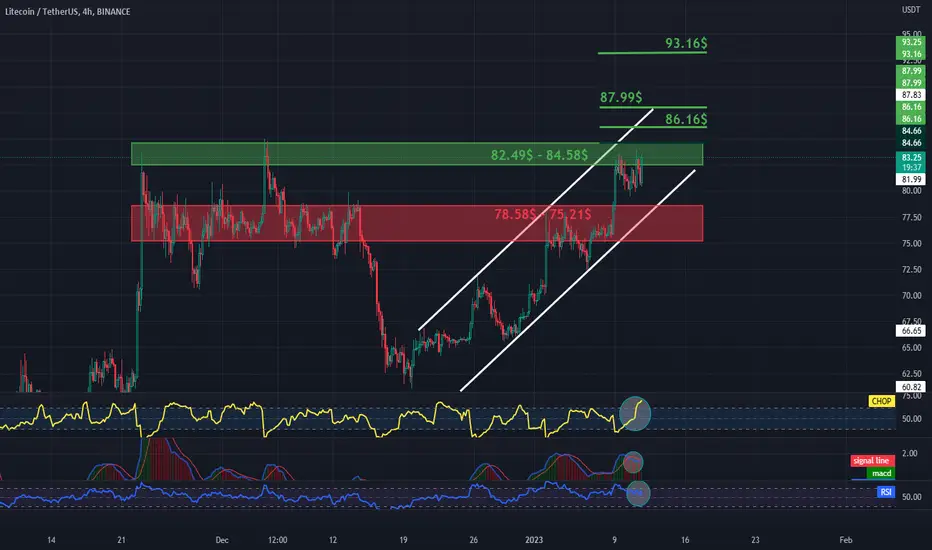
I invite you to a short analysis of LTC/USDT based on the four-hour interval.
Let's start by marking with the white lines the uptrend channel in which the price is currently moving.
Next, we can immediately notice a strong support zone from $82.49 to $84.58, which the price is currently struggling with. Moreover, looking at the recent move, we see that the upper border of the zone is strong resistance at 0.618 FIB, then we have resistance at $86.16, $87.99 and $93.16.
When it comes to support, it is worth highlighting the first strong support zone from $78.58 to $75.21, at which the price has been repeatedly stopped.
Looking at the CHOP index, we see that the energy is strongly charged, the MACD indicates a local downtrend, while the RSI index has recovered and has a new place for price growth.
Let's start by marking with the white lines the uptrend channel in which the price is currently moving.
Next, we can immediately notice a strong support zone from $82.49 to $84.58, which the price is currently struggling with. Moreover, looking at the recent move, we see that the upper border of the zone is strong resistance at 0.618 FIB, then we have resistance at $86.16, $87.99 and $93.16.
When it comes to support, it is worth highlighting the first strong support zone from $78.58 to $75.21, at which the price has been repeatedly stopped.
Looking at the CHOP index, we see that the energy is strongly charged, the MACD indicates a local downtrend, while the RSI index has recovered and has a new place for price growth.

Exención de responsabilidad
La información y las publicaciones no constituyen, ni deben considerarse como, asesoramiento o recomendaciones financieras, de inversión, de trading u otro tipo, proporcionadas o respaldadas por TradingView. Obtenga más información en Condiciones de uso.
Exención de responsabilidad
La información y las publicaciones no constituyen, ni deben considerarse como, asesoramiento o recomendaciones financieras, de inversión, de trading u otro tipo, proporcionadas o respaldadas por TradingView. Obtenga más información en Condiciones de uso.