
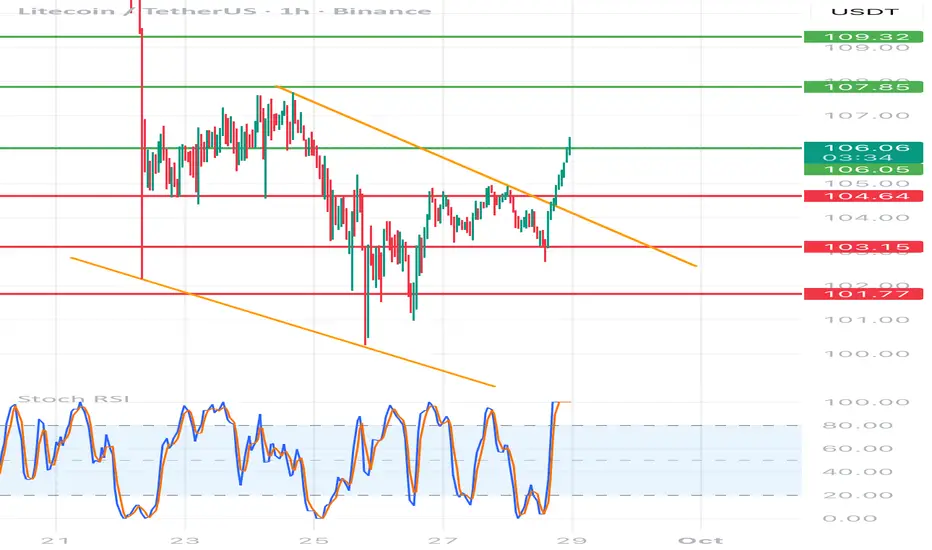
1. The inheritance channel (orange lines) - the course was in the downward trend, but just struck the mountain from the channel. This is a signal of short -term shift Momentum to upward.
2. Horizers of support/resistance (red and green lines):
• Support: 104.64, 103.15, 101.77 - you can see that the course reflected several times from these levels.
• Resistance: 106.05, 107.85, 109.32 - these levels are now key goals with further increases.
3. STOCHASTIC RSI (bottom of the chart) - is in the purchase zone (above 80). This suggests the possibility of short -term correction, but after struggling from the channel, the momentum can still pull the price higher before the stronger pullback occurs.
⸻
Scenarios:
✅ Taurus (continuation of stroke):
• If the price lasts above 106 USDT, subsequent goals are 107.85 and 109.32.
• Closing a few candles above 106.05 will confirm the burst and gives space for growth.
⚠️ Bear (false breakup):
• If the price does not last above 106 and returns to 104.64, the market may fall again to 103.15 and even 101.77.
⸻
Summary:
• The trend has changed to a short -term upward after having broken out of the downward channel.
• Keeping the level of 106 USDT is key - if it succeeds, there is a chance for an attack 107.85 → 109.32.
• RSI is high, so in a short time it is possible to lightly withdraw before we go higher.
2. Horizers of support/resistance (red and green lines):
• Support: 104.64, 103.15, 101.77 - you can see that the course reflected several times from these levels.
• Resistance: 106.05, 107.85, 109.32 - these levels are now key goals with further increases.
3. STOCHASTIC RSI (bottom of the chart) - is in the purchase zone (above 80). This suggests the possibility of short -term correction, but after struggling from the channel, the momentum can still pull the price higher before the stronger pullback occurs.
⸻
Scenarios:
✅ Taurus (continuation of stroke):
• If the price lasts above 106 USDT, subsequent goals are 107.85 and 109.32.
• Closing a few candles above 106.05 will confirm the burst and gives space for growth.
⚠️ Bear (false breakup):
• If the price does not last above 106 and returns to 104.64, the market may fall again to 103.15 and even 101.77.
⸻
Summary:
• The trend has changed to a short -term upward after having broken out of the downward channel.
• Keeping the level of 106 USDT is key - if it succeeds, there is a chance for an attack 107.85 → 109.32.
• RSI is high, so in a short time it is possible to lightly withdraw before we go higher.

Exención de responsabilidad
La información y las publicaciones no constituyen, ni deben considerarse como, asesoramiento o recomendaciones financieras, de inversión, de trading u otro tipo, proporcionadas o respaldadas por TradingView. Obtenga más información en Condiciones de uso.
Exención de responsabilidad
La información y las publicaciones no constituyen, ni deben considerarse como, asesoramiento o recomendaciones financieras, de inversión, de trading u otro tipo, proporcionadas o respaldadas por TradingView. Obtenga más información en Condiciones de uso.