MATIC/USDT price movement variantes
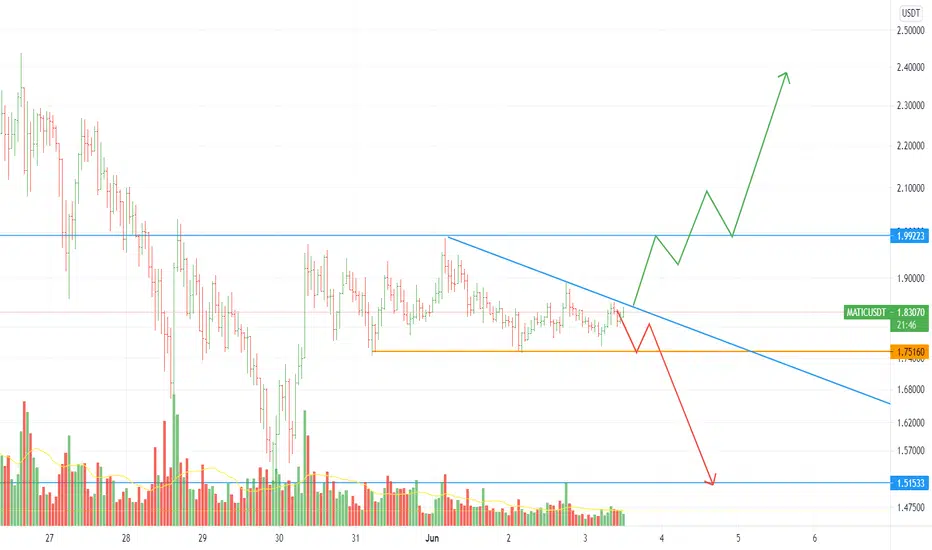
Let’s check the MATIC/USDT pair chart. Daily timeframe shows us that MATIC is trading into the narrow channel between $1.75 and $2. Moreover, we can notice that sellers try to press down the price to the $1.75 and lower. If the price closes under or above $2 it will be a strong signal to purchase MATIC in long. Besides further price movement of this pair depends on BTC. That’s why we need to follow BTC chart to make the right deal.

Exención de responsabilidad
La información y las publicaciones no constituyen, ni deben considerarse como, asesoramiento o recomendaciones financieras, de inversión, de trading u otro tipo, proporcionadas o respaldadas por TradingView. Obtenga más información en Condiciones de uso.
Exención de responsabilidad
La información y las publicaciones no constituyen, ni deben considerarse como, asesoramiento o recomendaciones financieras, de inversión, de trading u otro tipo, proporcionadas o respaldadas por TradingView. Obtenga más información en Condiciones de uso.