Actualizado
Polygon (MATIC) - October 26
Hello?
Welcome, traders.
By "following", you can always get new information quickly.
Please also click "Boost".
Have a good day.
-------------------------------------
(MATICUSDT 1W Chart)

Whether the price can rise above 1.2246 and sustain is the key.
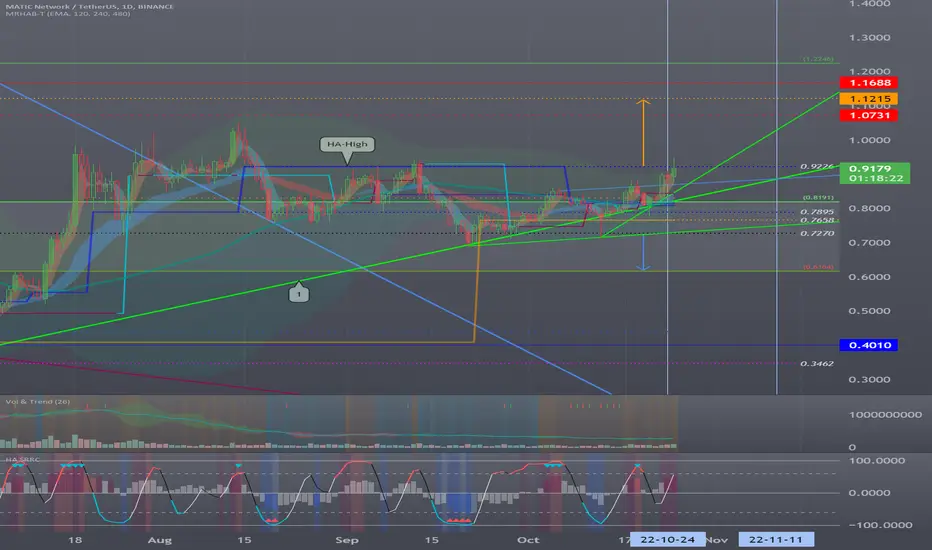
(1D chart)
A move above 0.9226 to hold the price is expected to lead to a move towards moving above 1.0731.
If not, you should see if there is support around 0.8191.
------------------------------------------------------------ -------------------------------------------
** All descriptions are for reference only and do not guarantee a profit or loss in investment.
** If you share this chart, you can use the indicators normally.
** The MRHAB-T indicator contains indicators that indicate support and resistance points.
** HA SRRC indicators are expressed as StochRSI(line), RSI(columns), CCI(bgcolor).
** CCI indicator is expressed as overbought range (CCI > +100) and oversold range (CCI < -100).
(Short-term Stop Loss can be said to be a point where profit and loss can be preserved or additional entry can be made through split trading. It is a short-term investment perspective.)
---------------------------------
Welcome, traders.
By "following", you can always get new information quickly.
Please also click "Boost".
Have a good day.
-------------------------------------
(MATICUSDT 1W Chart)
Whether the price can rise above 1.2246 and sustain is the key.
(1D chart)
A move above 0.9226 to hold the price is expected to lead to a move towards moving above 1.0731.
If not, you should see if there is support around 0.8191.
------------------------------------------------------------ -------------------------------------------
** All descriptions are for reference only and do not guarantee a profit or loss in investment.
** If you share this chart, you can use the indicators normally.
** The MRHAB-T indicator contains indicators that indicate support and resistance points.
** HA SRRC indicators are expressed as StochRSI(line), RSI(columns), CCI(bgcolor).
** CCI indicator is expressed as overbought range (CCI > +100) and oversold range (CCI < -100).
(Short-term Stop Loss can be said to be a point where profit and loss can be preserved or additional entry can be made through split trading. It is a short-term investment perspective.)
---------------------------------
Nota
(MATICBTC 1W chart)
[Practical trading strategy using HA-MS and SBOD]
youtu.be/aceN1AttX1Y
[Binance Futures Message Channel]
t.me/readcryptobns
[업비트 메시지 채널]
t.me/readcryptoubt
youtu.be/aceN1AttX1Y
[Binance Futures Message Channel]
t.me/readcryptobns
[업비트 메시지 채널]
t.me/readcryptoubt
Publicaciones relacionadas
Exención de responsabilidad
La información y las publicaciones no constituyen, ni deben considerarse como, asesoramiento o recomendaciones financieras, de inversión, de trading u otro tipo, proporcionadas o respaldadas por TradingView. Obtenga más información en Condiciones de uso.
[Practical trading strategy using HA-MS and SBOD]
youtu.be/aceN1AttX1Y
[Binance Futures Message Channel]
t.me/readcryptobns
[업비트 메시지 채널]
t.me/readcryptoubt
youtu.be/aceN1AttX1Y
[Binance Futures Message Channel]
t.me/readcryptobns
[업비트 메시지 채널]
t.me/readcryptoubt
Publicaciones relacionadas
Exención de responsabilidad
La información y las publicaciones no constituyen, ni deben considerarse como, asesoramiento o recomendaciones financieras, de inversión, de trading u otro tipo, proporcionadas o respaldadas por TradingView. Obtenga más información en Condiciones de uso.