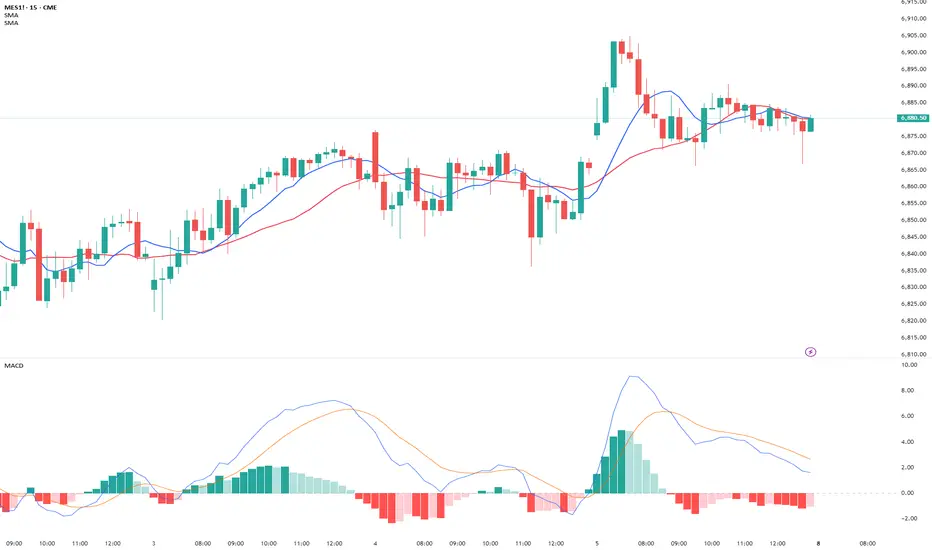
Trading Future - 1-Minute Timeframe  MES1!
MES1!  ES1!
ES1!  M2K1!
M2K1!
RSI Low (Reversal) Entry Strategy

Spot ENTRY

Trend completed - Succeed !
Entry Criteria
✔ RSI Low alert
✔ RSI crosses above MA
✔ Price crosses above SMA9
✔ Price pullback holds SMA9
✔ Optional: Price above SMA20 for stronger confirmation
Exit Criteria
❌ Price closes below SMA9
❌ Price falls below HMA-Low (secondary exit)
❌ Price hits target below HMA-High line
Indicators Setup:
1. HMA Low/High – Length 15
Entry: Price crosses above HMA-Low and stays inside the HMA channel.
Exit: Price falls below SMA 9 OR price goes below HMA-Low line (secondary exit).
2. SMA 9 (Blue)
Entry: Price pulls back to SMA9 but does not fall under it.
Exit: Price falls under SMA9.
3. SMA 20 (Red)
Confirmation trend line.
Entry Confirmation: Price crosses above SMA20.
4. SMA 70 (Teal)
Higher-timeframe trend bias.
5. RSI (14) – Low/High 30/70
Reversal signal at RSI Low.
RSI extreme lows highlight with BG color.
6. MACD Histogram (12/26/9)
Trend confirmation: Histogram cross above 0 = momentum shift upward.
Trading Steps:
1. Identify the RSI Low (Alert)
RSI prints a lowest point and background highlights in the extreme zone.
2. RSI Crosses Above Its MA (Yellow)
RSI breaks above its MA = early upward momentum.
At the same time:
Price crosses above SMA 9 (blue).
3. Entry Trigger
Wait for a price pullback to SMA9,
BUT price must not break below SMA9.
If SMA9 holds support → Enter long.
4. Stop Loss Rules
Primary Stop Loss: Price closes below SMA 9 (blue).
Secondary Stop Loss: Price dips just under HMA-Low = early trend failure.
5. Position Hold Conditions (Confirmation)
Hold the trade ONLY IF:
Price stays above SMA 9.
MACD Histogram crosses above 0
→ Trend shifts from negative to positive, confirming upward movement.
6. Ride the Trend
Let price continue inside HMA channel.
Wait for trend to complete (usually when RSI approaches 70 or MACD weakens).
7. Profit Taking (Exit Rules)
Option A: HMA-High line target
Set take-profit just below HMA-High line.
Option B: SMA9 Breakdown
Exit when price falls below SMA 9 (blue).
MES1! ES1! M2K1! RSI Low (Reversal) Entry Strategy
Spot ENTRY
Trend completed - Succeed !
Entry Criteria
✔ RSI Low alert
✔ RSI crosses above MA
✔ Price crosses above SMA9
✔ Price pullback holds SMA9
✔ Optional: Price above SMA20 for stronger confirmation
Exit Criteria
❌ Price closes below SMA9
❌ Price falls below HMA-Low (secondary exit)
❌ Price hits target below HMA-High line
Indicators Setup:
1. HMA Low/High – Length 15
Entry: Price crosses above HMA-Low and stays inside the HMA channel.
Exit: Price falls below SMA 9 OR price goes below HMA-Low line (secondary exit).
2. SMA 9 (Blue)
Entry: Price pulls back to SMA9 but does not fall under it.
Exit: Price falls under SMA9.
3. SMA 20 (Red)
Confirmation trend line.
Entry Confirmation: Price crosses above SMA20.
4. SMA 70 (Teal)
Higher-timeframe trend bias.
5. RSI (14) – Low/High 30/70
Reversal signal at RSI Low.
RSI extreme lows highlight with BG color.
6. MACD Histogram (12/26/9)
Trend confirmation: Histogram cross above 0 = momentum shift upward.
Trading Steps:
1. Identify the RSI Low (Alert)
RSI prints a lowest point and background highlights in the extreme zone.
2. RSI Crosses Above Its MA (Yellow)
RSI breaks above its MA = early upward momentum.
At the same time:
Price crosses above SMA 9 (blue).
3. Entry Trigger
Wait for a price pullback to SMA9,
BUT price must not break below SMA9.
If SMA9 holds support → Enter long.
4. Stop Loss Rules
Primary Stop Loss: Price closes below SMA 9 (blue).
Secondary Stop Loss: Price dips just under HMA-Low = early trend failure.
5. Position Hold Conditions (Confirmation)
Hold the trade ONLY IF:
Price stays above SMA 9.
MACD Histogram crosses above 0
→ Trend shifts from negative to positive, confirming upward movement.
6. Ride the Trend
Let price continue inside HMA channel.
Wait for trend to complete (usually when RSI approaches 70 or MACD weakens).
7. Profit Taking (Exit Rules)
Option A: HMA-High line target
Set take-profit just below HMA-High line.
Option B: SMA9 Breakdown
Exit when price falls below SMA 9 (blue).

Exención de responsabilidad
La información y las publicaciones no constituyen, ni deben considerarse como, asesoramiento o recomendaciones financieras, de inversión, de trading u otro tipo, proporcionadas o respaldadas por TradingView. Obtenga más información en Condiciones de uso.
Exención de responsabilidad
La información y las publicaciones no constituyen, ni deben considerarse como, asesoramiento o recomendaciones financieras, de inversión, de trading u otro tipo, proporcionadas o respaldadas por TradingView. Obtenga más información en Condiciones de uso.