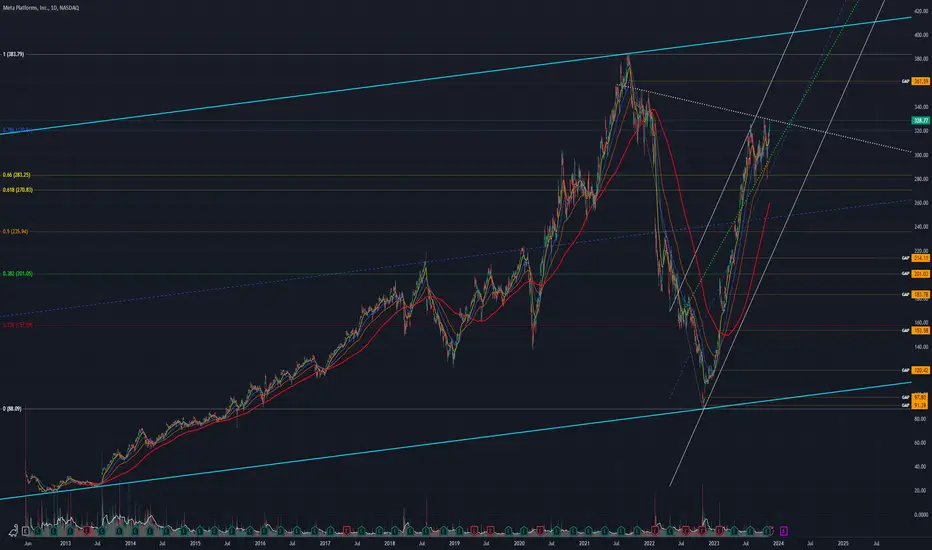
 META chart mapping/analysis.
Bullish consolidation higher within an ascending parallel channel (white).
Bull target(s)
- Breakout above descending trend-line resistance (white dotted)
- Overhead gap fill (~361.59)
- Prev ATH + upper range of parallel channel (light blue) confluence resistance zone
Bear target(s)
- Ascending trend-line support (green dotted)
- Golden Fib Pocket
- Lower range of ascending parallel channel (white)
- 50% Fib
- Underlying gap fills (~214.11 / ~201.03 / ~183.78)
- 38.2% + gap fill (~201.03) confluence support zone
Nota
Note: TradingView chart was dividend adjusted (ADJ) when mapped.
Publicaciones relacionadas
Exención de responsabilidad
La información y las publicaciones no constituyen, ni deben considerarse como, asesoramiento o recomendaciones financieras, de inversión, de trading u otro tipo, proporcionadas o respaldadas por TradingView. Obtenga más información en Condiciones de uso.
Publicaciones relacionadas
Exención de responsabilidad
La información y las publicaciones no constituyen, ni deben considerarse como, asesoramiento o recomendaciones financieras, de inversión, de trading u otro tipo, proporcionadas o respaldadas por TradingView. Obtenga más información en Condiciones de uso.