
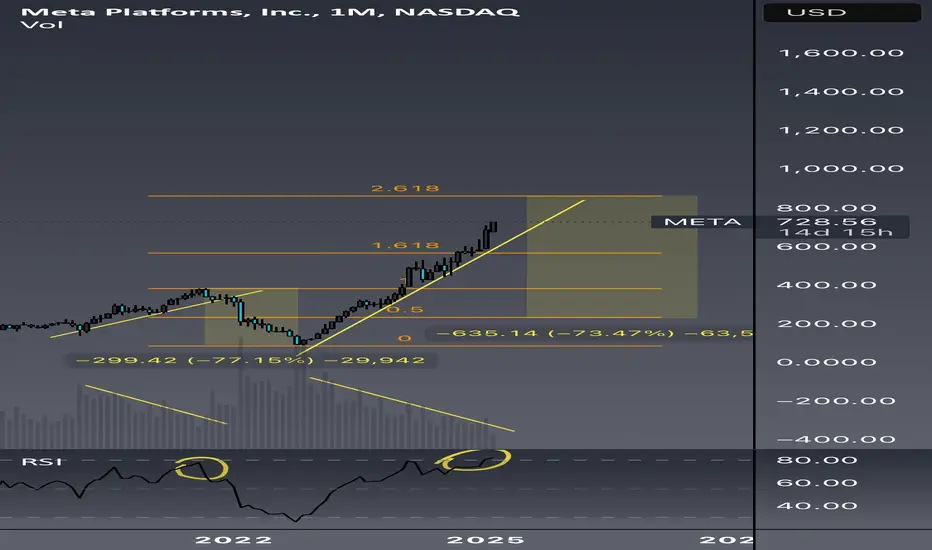
Just a little fun and brainstorming with higher time frame charts. Utilizing RSI, patterns, and time cycles.
Lots of similarities between now and the 2020-2021 bull run. Not to mention a lot of good data suggesting we are close to a recession at best. (Weak housing data/stocks, yield curve uninversion)
What are your thoughts?
Lots of similarities between now and the 2020-2021 bull run. Not to mention a lot of good data suggesting we are close to a recession at best. (Weak housing data/stocks, yield curve uninversion)
What are your thoughts?

Exención de responsabilidad
La información y las publicaciones no constituyen, ni deben considerarse como, asesoramiento o recomendaciones financieras, de inversión, de trading u otro tipo, proporcionadas o respaldadas por TradingView. Obtenga más información en Condiciones de uso.
Exención de responsabilidad
La información y las publicaciones no constituyen, ni deben considerarse como, asesoramiento o recomendaciones financieras, de inversión, de trading u otro tipo, proporcionadas o respaldadas por TradingView. Obtenga más información en Condiciones de uso.