
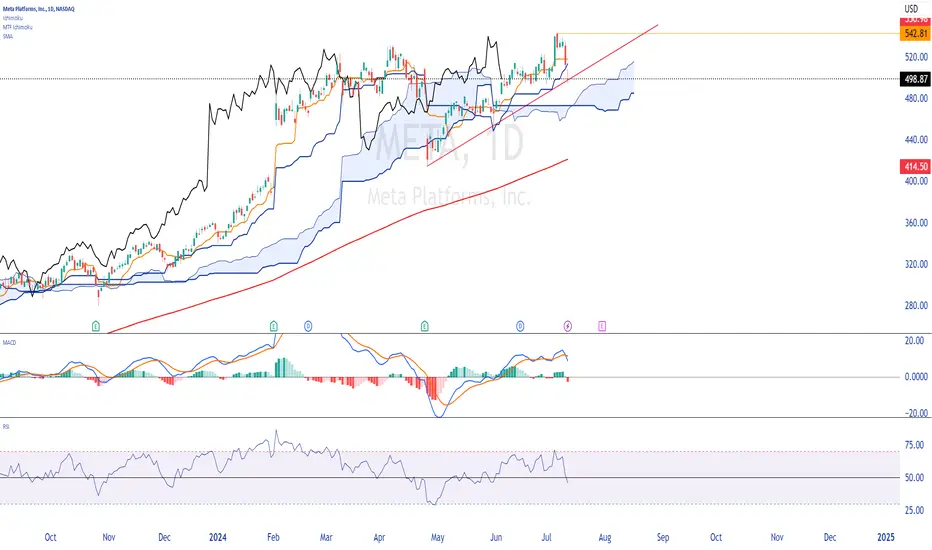
Daily chart with ichimoku.
Price under the tankan and under the kinjun.
We are above the cloud. Be careful, the cloud is thin and prices could pass through it easily.
The SMA 200 is under the cloud, so no worries.
MACD increasing, but above the 0 line.
The RSI is slightly below 50.
To conclude, the trend is bullish, we must monitor the break of my red line, which could announce a corrective movement.
Happy trading to you.
Price under the tankan and under the kinjun.
We are above the cloud. Be careful, the cloud is thin and prices could pass through it easily.
The SMA 200 is under the cloud, so no worries.
MACD increasing, but above the 0 line.
The RSI is slightly below 50.
To conclude, the trend is bullish, we must monitor the break of my red line, which could announce a corrective movement.
Happy trading to you.

Exención de responsabilidad
La información y las publicaciones no constituyen, ni deben considerarse como, asesoramiento o recomendaciones financieras, de inversión, de trading u otro tipo, proporcionadas o respaldadas por TradingView. Obtenga más información en Condiciones de uso.
Exención de responsabilidad
La información y las publicaciones no constituyen, ni deben considerarse como, asesoramiento o recomendaciones financieras, de inversión, de trading u otro tipo, proporcionadas o respaldadas por TradingView. Obtenga más información en Condiciones de uso.