
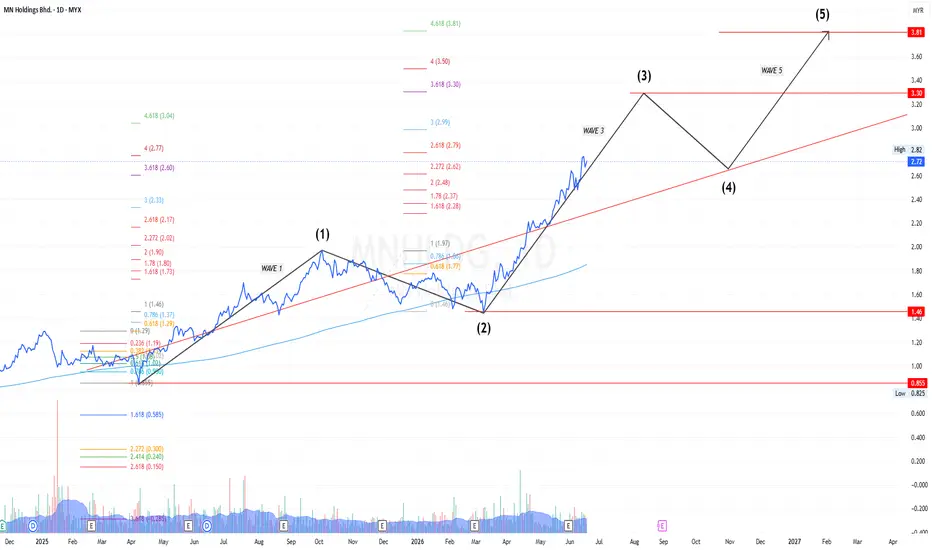
Based on the daily chart of MNHLDG, the price action is carving out a highly Impulse Wave (Motive Wave) structure according to Elliott Wave Theory.
Following the completion of Wave 1 and a healthy Wave 2 correction that held firmly above the critical RM1.46 support, the market is currently accelerating within a powerful Wave 3. Backed by Fibonacci extension levels, this dominant wave is currently eyeing a primary target around the RM3.30 region.
Identifying these Motive Waves (Waves 1, 3, and 5) is essential for trend followers, as Wave 3 typically represents the strongest and most extended part of the cycle. Looking ahead, once Wave 3 peaks near RM3.30, we anticipate a temporary Wave 4 retracement before a final Wave 5 push towards the long-term target of RM3.81.
This analysis focuses strictly on highlighting the motive sequence. Detailed updates regarding the subsequent corrective structures will only be provided once Wave 5 satisfies the end of its cycle and exhibits clear momentum divergence.
Educational Disclaimer: This chart is for educational purposes and purely based on technical analysis, not a buy/sell call. All entries, stop-loss setups, and RRR are entirely subject to your own risk evaluation. The author assumes no responsibility for market volatility or potential third-party manipulation/pump-and-dump anomalies. Always DYOR.
Following the completion of Wave 1 and a healthy Wave 2 correction that held firmly above the critical RM1.46 support, the market is currently accelerating within a powerful Wave 3. Backed by Fibonacci extension levels, this dominant wave is currently eyeing a primary target around the RM3.30 region.
Identifying these Motive Waves (Waves 1, 3, and 5) is essential for trend followers, as Wave 3 typically represents the strongest and most extended part of the cycle. Looking ahead, once Wave 3 peaks near RM3.30, we anticipate a temporary Wave 4 retracement before a final Wave 5 push towards the long-term target of RM3.81.
This analysis focuses strictly on highlighting the motive sequence. Detailed updates regarding the subsequent corrective structures will only be provided once Wave 5 satisfies the end of its cycle and exhibits clear momentum divergence.
Educational Disclaimer: This chart is for educational purposes and purely based on technical analysis, not a buy/sell call. All entries, stop-loss setups, and RRR are entirely subject to your own risk evaluation. The author assumes no responsibility for market volatility or potential third-party manipulation/pump-and-dump anomalies. Always DYOR.

Exención de responsabilidad
La información y las publicaciones no constituyen, ni deben considerarse como, asesoramiento o recomendaciones financieras, de inversión, de trading u otro tipo, proporcionadas o respaldadas por TradingView. Obtenga más información en Condiciones de uso.
Exención de responsabilidad
La información y las publicaciones no constituyen, ni deben considerarse como, asesoramiento o recomendaciones financieras, de inversión, de trading u otro tipo, proporcionadas o respaldadas por TradingView. Obtenga más información en Condiciones de uso.