
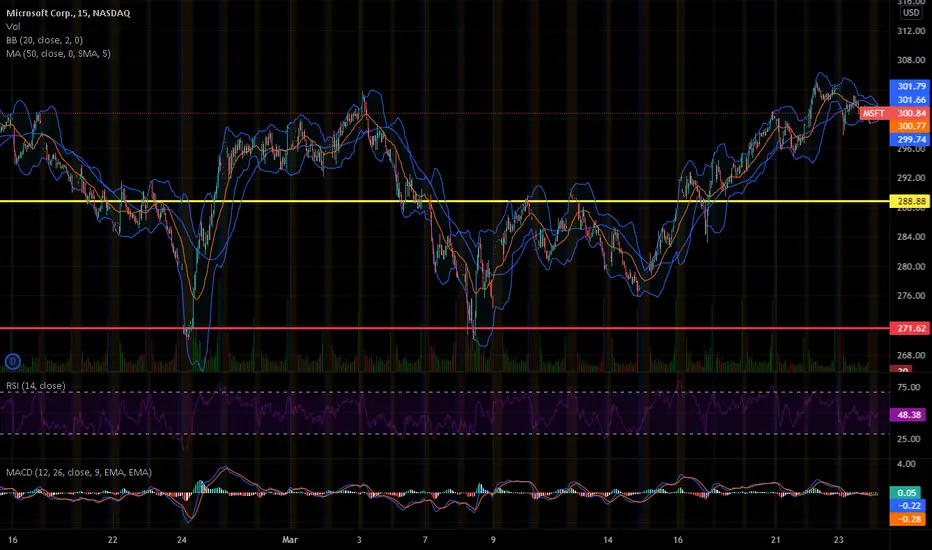
When looking at a combination of indicators on the 15-minutes chart that best represents Microsoft's recent volatility, A kind of resistance line was found. When examining the minimum threshold for MACD and RSI, it shows strong support at the $271 level. Using the red line as a stepping stone, stock prices are currently active around the yellow line at the $288.

Exención de responsabilidad
La información y las publicaciones no constituyen, ni deben considerarse como, asesoramiento o recomendaciones financieras, de inversión, de trading u otro tipo, proporcionadas o respaldadas por TradingView. Obtenga más información en Condiciones de uso.
Exención de responsabilidad
La información y las publicaciones no constituyen, ni deben considerarse como, asesoramiento o recomendaciones financieras, de inversión, de trading u otro tipo, proporcionadas o respaldadas por TradingView. Obtenga más información en Condiciones de uso.