
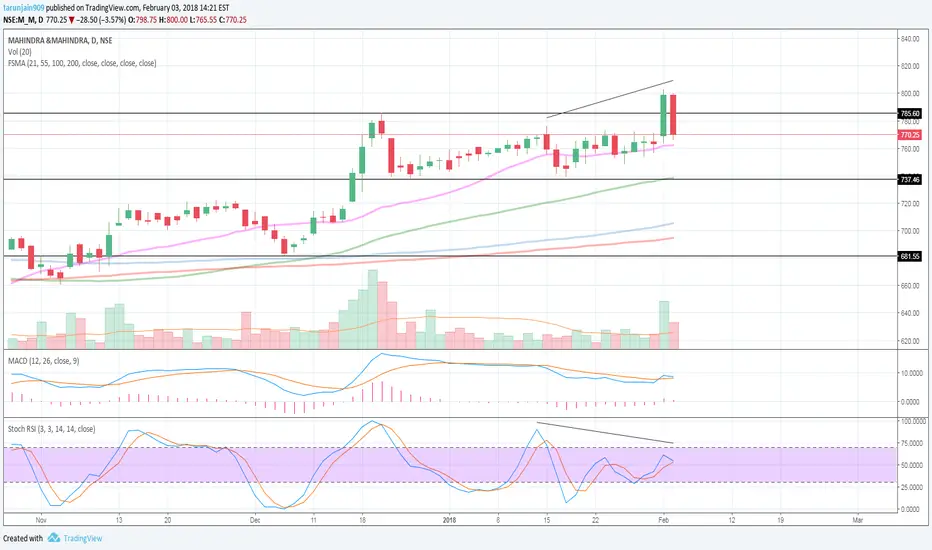
M&M showing signs of trend reversal here..
Signals -
1. RSI divergence
2. Overbought
3. Bearish Engulf Candle
Targets on the right in black.
This chart is for study/educational purpose only.
Please DYOR.
I won't be liable for any P/L made by using above chart.
Signals -
1. RSI divergence
2. Overbought
3. Bearish Engulf Candle
Targets on the right in black.
This chart is for study/educational purpose only.
Please DYOR.
I won't be liable for any P/L made by using above chart.
Nota
As shown on chart, T1 and T2 are met.Operación cerrada: objetivo alcanzado

Exención de responsabilidad
La información y las publicaciones no constituyen, ni deben considerarse como, asesoramiento o recomendaciones financieras, de inversión, de trading u otro tipo, proporcionadas o respaldadas por TradingView. Obtenga más información en Condiciones de uso.
Exención de responsabilidad
La información y las publicaciones no constituyen, ni deben considerarse como, asesoramiento o recomendaciones financieras, de inversión, de trading u otro tipo, proporcionadas o respaldadas por TradingView. Obtenga más información en Condiciones de uso.