
🏴☠️ US100 / NAS100 NASDAQ 100 INDEX CFD – Liquidity Grab Heist Plan 📈 Bullish Day/Swing Trade Guide 💎
--------------------------------------------------------------------------------
🏴☠️ WELCOME, THIEF OG's! 💰
Hello, Hola, Bonjour, Ola, Hallo, Marhaba, Ladies & Gentlemen, Money Makers & Market Heisters! 🌍🤑💸
The vault door of the NASDAQ 100 (US100 / NAS100 / NDX) Index CFD is open again, and here is my full Thief Trader trade opportunity guide for Day Trade and Swing Trade styles. Read it slowly, grab a coffee ☕ and study the map.
--------------------------------------------------------------------------------
🔎 MY ANALYSIS
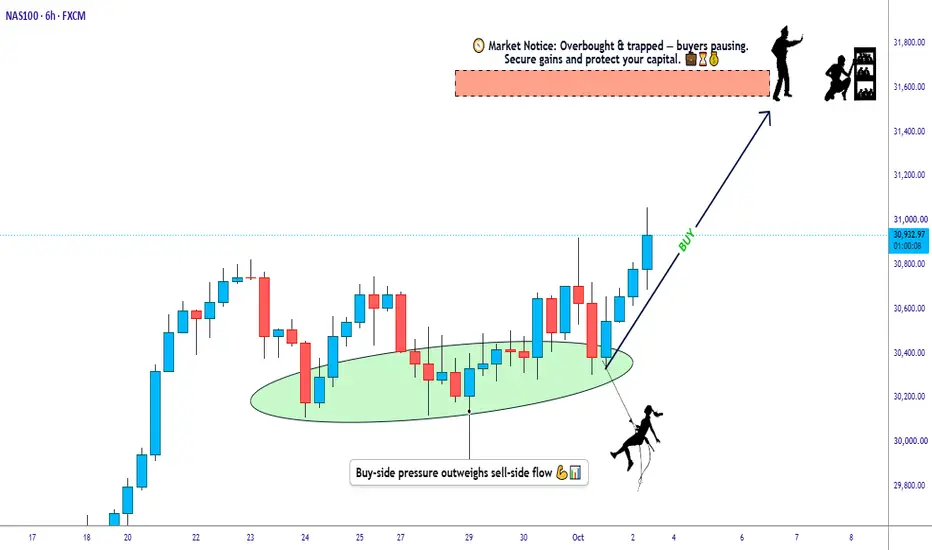
The NASDAQ 100 is trading in a high-volatility zone where smart liquidity hunts are happening on both sides of the range. I am watching the accumulation side, where sellers get trapped after a liquidity grab (a sweep of the sell-side stops below the range). When late sellers jump in and the price snaps back, it often leaves a clean footprint on the chart.
My plan is built around this one idea: let the sellers get trapped first, then plan the entry with the structure turning back up. 🎯
- Setup type: Liquidity grab + trapped sellers on the accumulation side
- Style: Day Trade / Swing Trade
- Instrument: US100 / NAS100 (NASDAQ 100 Index CFD)
--------------------------------------------------------------------------------
🧭 MY MARKET BIAS
My market bias: BULLISH 🐂📈
The trap-and-reverse behaviour on the accumulation side is the reason for this bias. It is my personal view of the chart and not a certainty of any kind. Markets can and do change direction fast, so always respect your own risk plan.
--------------------------------------------------------------------------------
🗺️ POSSIBLE SCENARIO (THE HEIST PLAN)
📍 Entry idea: Accumulation side after the liquidity grab, when sellers are trapped
🎯 Main / Final target: 31600
🛑 Thief Stop Loss: 30500
How I see the possible scenario:
- Price sweeps the sell-side liquidity and traps the sellers
- Buyers step back in around the accumulation area
- Price rotates upward toward the resistance zone
- Around 31600 I expect heavy pressure from the "Police Force" resistance zone: overbought conditions, trap risk and reversal risk all meet there 🚔
- So my plan is to escape with profits near that zone, before the police arrive 🏃♂️💨
⚠️ TP NOTE: Dear Ladies & Gentlemen (Thief OG's), I do not recommend using only my TP. It is your own choice. You can take your money earlier, at your own risk. 💵
⚠️ SL NOTE: Dear Ladies & Gentlemen (Thief OG's), I do not recommend using only my SL. It is your own choice. Set your stop according to your own risk, lot size and account plan, at your own risk. 🛡️
--------------------------------------------------------------------------------
👀 AREAS I AM WATCHING
- 30500 zone: my Thief SL reference and the lower boundary of the plan
- The accumulation zone where the liquidity grab and trapped sellers appear
- Recent record-high area: the NASDAQ 100 printed a fresh all-time high today, so price discovery above it matters
- 31600 zone: my final target and the "Police Force" resistance (overbought, trap and reversal zone)
- Candle behaviour (rejection wicks, engulfing candles, closes back above the swept low) for confirmation
--------------------------------------------------------------------------------
📚 EDUCATIONAL BREAKDOWN
Why do liquidity grabs matter? 🤔
- Stop-loss orders cluster below obvious lows. Large players need that liquidity to fill big orders.
- When the price dips into that zone and quickly snaps back, many sellers who entered late are trapped on the wrong side. Their exit orders can then add fuel to the move up.
- Accumulation means price moves sideways while orders are quietly collected before a directional move.
- Overbought means price has stretched far and fast, so pullbacks and reversals become more common near resistance. That is why I plan to exit before the finish line and not at the very top.
- Always size your position so that one stop-out is a small, planned cost.
This is for education and idea sharing only.
--------------------------------------------------------------------------------
💱 RELATED PAIRS & ASSETS TO WATCH (USD-DENOMINATED)
Approximate live snapshot, Friday 02 October 2026, roughly 14:00 to 15:30 London time (BST). CFD prices vary by broker, so always verify on your own platform.
📊 US500 (S&P 500 Index CFD): around 7,666 at the previous close, trading higher on the day. The S&P 500 and NASDAQ 100 usually move in the same direction because they share big technology names. When one breaks out, watch for the other to confirm.
📊 US30 (Dow Jones Index CFD): around 50,900 area at the previous close, up on the day. The Dow is less tech-heavy, so if it lags while the NASDAQ leads, the rally is narrower and driven mostly by tech.
💵 DXY (US Dollar Index): around 101.8 to 101.9, down about 0.2% after the jobs data. The dollar and tech stocks often move inversely. A softer dollar usually helps risk assets, while a stronger dollar tends to pressure them.
💶 EUR/USD: around 1.1250 to 1.1260. The pair is the biggest part of the DXY basket, so it mirrors the dollar's moves in reverse. Rising EUR/USD usually points to a softer dollar.
💴 USD/JPY: around 157.5 to 157.7. Yen moves reflect global risk appetite and rate differentials. A sharp yen rally can unwind carry trades and hit equities, so I keep it on the radar.
🥇 XAU/USD (Gold): around 4,210 to 4,217 USD per ounce, up close to 0.8% on the day. Gold reacts to real yields and the dollar, and often rises when rate-hike expectations cool.
🛢️ USOIL (WTI Crude): roughly 89 to 92 USD per barrel, falling intraday after reports that the EU discussed releasing diesel stockpiles. Oil is a key inflation input, so it feeds into rate expectations and then into tech valuations.
₿ BTC/USD (Bitcoin): around 86,000 to 87,000 USD. Bitcoin often trades as a high-beta risk asset alongside tech stocks and is also sensitive to Treasury yields.
🏦 US10Y (10-Year Treasury Yield): around 5.22% to 5.25%, after touching about 5.3% on Thursday, which is the highest level in more than two decades. Higher yields raise the discount rate on growth stocks, so this is one of the most important correlation drivers for the NASDAQ 100.
🧠 NVDA (Nvidia, USD): printed a new record intraday high today and is one of the heaviest influences on the NASDAQ 100. Semiconductor strength, including Micron's earnings reaction on Thursday, has been a key support for the index.
--------------------------------------------------------------------------------
📰 LATEST FUNDAMENTAL & ECONOMIC FACTORS (NEUTRAL MARKET READ)
This section reports what the market is showing right now. It is not filtered for or against my trade idea.
🇺🇸 US Jobs Report (released today, 13:30 London time):
- Nonfarm Payrolls: +29K versus around +90K expected. August was revised down to +133K from +162K.
- Unemployment Rate: 4.2% versus 4.1% expected.
- Average Hourly Earnings: +0.1% month on month versus +0.3% expected, and 3.0% year on year versus 3.2% expected.
- Market reaction: Fed rate-hike expectations for October dropped sharply (one report cites roughly 19.5%, down from near 69% a week earlier). The NASDAQ 100 jumped about 1.3% to a record high near 30,950 during the US morning.
🏦 Federal Reserve:
- The Fed raised rates by 25bp to 3.75% to 4.00% at the 16 September meeting.
- Yesterday's PCE inflation data was softer than expected, though some analysts noted methodology changes affected the reading.
- Inflation is still elevated: headline CPI was 3.4% year on year for August.
📉 Bond Market:
- The 10-year Treasury yield hit about 5.3% on Thursday, its highest since 2002, then eased to around 5.22%. The 30-year yield is near 5.6%.
- Rising long-end yields remain a headwind for equity valuations, while any pullback in yields has supported stocks lately.
🛢️ Energy & Geopolitics:
- The US-Iran conflict remains a live headline risk for oil and inflation expectations.
- Oil fell today on EU stockpile release reports, but China's refiners reportedly banned October fuel exports, so energy remains volatile in both directions.
🇯🇵 Japan: Tokyo core CPI accelerated to 2.7%, giving the yen a bid early today.
💵 Dollar: DXY is near multi-month highs (about 17-month highs) around 102 earlier this week before easing today.
🏢 Earnings & Index News:
- Micron's strong results boosted chip stocks on Thursday.
- Nike fell on a downbeat earnings report.
- Moderna is replacing Warner Bros in the NASDAQ 100 index.
🗓️ UPCOMING NEWS (LONDON / BST TIME)
- Mon 05 Oct, 15:00: US ISM Services PMI (September). Fed's Goolsbee speaks
- Tue 06 Oct: Fed's Williams and Bowman speak
- Wed 07 Oct, 19:00: FOMC Minutes (September meeting)
- Thu 08 Oct, 13:30: US Initial Jobless Claims
- Wed 14 Oct, 13:30: US CPI (September)
- Wed 28 Oct, 18:00 (London time): FOMC interest rate decision
High-impact news can cause sharp spikes and slippage. Many traders reduce size or stay flat around these events.
--------------------------------------------------------------------------------
🚨 RISK DISCLAIMER
This is my personal market view, shared for educational and idea-sharing purposes only. It is not financial advice and not a recommendation to buy or sell anything. My TP and SL levels are reference points, not mandatory instructions. CFDs are leveraged products and carry a high risk of loss. Trade at your own risk, use your own analysis, and only risk what you can afford to lose. 🛡️
--------------------------------------------------------------------------------
💬 THIEF TRADER WISDOM & WISHES
"A smart thief doesn't chase the vault, he waits for the guards to look the other way." 🕶️
"Patience is the master key. Greed is the alarm bell." 🔑🔔
"Take your loot, leave before the police arrive, and come back to heist another day." 🏃♂️💰
Wishing all my Thief OG's a calm mind, sharp eyes and disciplined risk management. 🤝❤️ Stay safe, stay sharp, and let the market pay you in patience! 🏴☠️💎
If this idea gave you value, hit that LIKE 👍, FOLLOW 🔔 and drop your thoughts in the COMMENTS 💬. Your support keeps the heist crew rolling! 🚀
See you at the next heist plan. Keep stealing the market, responsibly! 🏴☠️💸
--------------------------------------------------------------------------------
--------------------------------------------------------------------------------
🏴☠️ WELCOME, THIEF OG's! 💰
Hello, Hola, Bonjour, Ola, Hallo, Marhaba, Ladies & Gentlemen, Money Makers & Market Heisters! 🌍🤑💸
The vault door of the NASDAQ 100 (US100 / NAS100 / NDX) Index CFD is open again, and here is my full Thief Trader trade opportunity guide for Day Trade and Swing Trade styles. Read it slowly, grab a coffee ☕ and study the map.
--------------------------------------------------------------------------------
🔎 MY ANALYSIS
The NASDAQ 100 is trading in a high-volatility zone where smart liquidity hunts are happening on both sides of the range. I am watching the accumulation side, where sellers get trapped after a liquidity grab (a sweep of the sell-side stops below the range). When late sellers jump in and the price snaps back, it often leaves a clean footprint on the chart.
My plan is built around this one idea: let the sellers get trapped first, then plan the entry with the structure turning back up. 🎯
- Setup type: Liquidity grab + trapped sellers on the accumulation side
- Style: Day Trade / Swing Trade
- Instrument: US100 / NAS100 (NASDAQ 100 Index CFD)
--------------------------------------------------------------------------------
🧭 MY MARKET BIAS
My market bias: BULLISH 🐂📈
The trap-and-reverse behaviour on the accumulation side is the reason for this bias. It is my personal view of the chart and not a certainty of any kind. Markets can and do change direction fast, so always respect your own risk plan.
--------------------------------------------------------------------------------
🗺️ POSSIBLE SCENARIO (THE HEIST PLAN)
📍 Entry idea: Accumulation side after the liquidity grab, when sellers are trapped
🎯 Main / Final target: 31600
🛑 Thief Stop Loss: 30500
How I see the possible scenario:
- Price sweeps the sell-side liquidity and traps the sellers
- Buyers step back in around the accumulation area
- Price rotates upward toward the resistance zone
- Around 31600 I expect heavy pressure from the "Police Force" resistance zone: overbought conditions, trap risk and reversal risk all meet there 🚔
- So my plan is to escape with profits near that zone, before the police arrive 🏃♂️💨
⚠️ TP NOTE: Dear Ladies & Gentlemen (Thief OG's), I do not recommend using only my TP. It is your own choice. You can take your money earlier, at your own risk. 💵
⚠️ SL NOTE: Dear Ladies & Gentlemen (Thief OG's), I do not recommend using only my SL. It is your own choice. Set your stop according to your own risk, lot size and account plan, at your own risk. 🛡️
--------------------------------------------------------------------------------
👀 AREAS I AM WATCHING
- 30500 zone: my Thief SL reference and the lower boundary of the plan
- The accumulation zone where the liquidity grab and trapped sellers appear
- Recent record-high area: the NASDAQ 100 printed a fresh all-time high today, so price discovery above it matters
- 31600 zone: my final target and the "Police Force" resistance (overbought, trap and reversal zone)
- Candle behaviour (rejection wicks, engulfing candles, closes back above the swept low) for confirmation
--------------------------------------------------------------------------------
📚 EDUCATIONAL BREAKDOWN
Why do liquidity grabs matter? 🤔
- Stop-loss orders cluster below obvious lows. Large players need that liquidity to fill big orders.
- When the price dips into that zone and quickly snaps back, many sellers who entered late are trapped on the wrong side. Their exit orders can then add fuel to the move up.
- Accumulation means price moves sideways while orders are quietly collected before a directional move.
- Overbought means price has stretched far and fast, so pullbacks and reversals become more common near resistance. That is why I plan to exit before the finish line and not at the very top.
- Always size your position so that one stop-out is a small, planned cost.
This is for education and idea sharing only.
--------------------------------------------------------------------------------
💱 RELATED PAIRS & ASSETS TO WATCH (USD-DENOMINATED)
Approximate live snapshot, Friday 02 October 2026, roughly 14:00 to 15:30 London time (BST). CFD prices vary by broker, so always verify on your own platform.
📊 US500 (S&P 500 Index CFD): around 7,666 at the previous close, trading higher on the day. The S&P 500 and NASDAQ 100 usually move in the same direction because they share big technology names. When one breaks out, watch for the other to confirm.
📊 US30 (Dow Jones Index CFD): around 50,900 area at the previous close, up on the day. The Dow is less tech-heavy, so if it lags while the NASDAQ leads, the rally is narrower and driven mostly by tech.
💵 DXY (US Dollar Index): around 101.8 to 101.9, down about 0.2% after the jobs data. The dollar and tech stocks often move inversely. A softer dollar usually helps risk assets, while a stronger dollar tends to pressure them.
💶 EUR/USD: around 1.1250 to 1.1260. The pair is the biggest part of the DXY basket, so it mirrors the dollar's moves in reverse. Rising EUR/USD usually points to a softer dollar.
💴 USD/JPY: around 157.5 to 157.7. Yen moves reflect global risk appetite and rate differentials. A sharp yen rally can unwind carry trades and hit equities, so I keep it on the radar.
🥇 XAU/USD (Gold): around 4,210 to 4,217 USD per ounce, up close to 0.8% on the day. Gold reacts to real yields and the dollar, and often rises when rate-hike expectations cool.
🛢️ USOIL (WTI Crude): roughly 89 to 92 USD per barrel, falling intraday after reports that the EU discussed releasing diesel stockpiles. Oil is a key inflation input, so it feeds into rate expectations and then into tech valuations.
₿ BTC/USD (Bitcoin): around 86,000 to 87,000 USD. Bitcoin often trades as a high-beta risk asset alongside tech stocks and is also sensitive to Treasury yields.
🏦 US10Y (10-Year Treasury Yield): around 5.22% to 5.25%, after touching about 5.3% on Thursday, which is the highest level in more than two decades. Higher yields raise the discount rate on growth stocks, so this is one of the most important correlation drivers for the NASDAQ 100.
🧠 NVDA (Nvidia, USD): printed a new record intraday high today and is one of the heaviest influences on the NASDAQ 100. Semiconductor strength, including Micron's earnings reaction on Thursday, has been a key support for the index.
--------------------------------------------------------------------------------
📰 LATEST FUNDAMENTAL & ECONOMIC FACTORS (NEUTRAL MARKET READ)
This section reports what the market is showing right now. It is not filtered for or against my trade idea.
🇺🇸 US Jobs Report (released today, 13:30 London time):
- Nonfarm Payrolls: +29K versus around +90K expected. August was revised down to +133K from +162K.
- Unemployment Rate: 4.2% versus 4.1% expected.
- Average Hourly Earnings: +0.1% month on month versus +0.3% expected, and 3.0% year on year versus 3.2% expected.
- Market reaction: Fed rate-hike expectations for October dropped sharply (one report cites roughly 19.5%, down from near 69% a week earlier). The NASDAQ 100 jumped about 1.3% to a record high near 30,950 during the US morning.
🏦 Federal Reserve:
- The Fed raised rates by 25bp to 3.75% to 4.00% at the 16 September meeting.
- Yesterday's PCE inflation data was softer than expected, though some analysts noted methodology changes affected the reading.
- Inflation is still elevated: headline CPI was 3.4% year on year for August.
📉 Bond Market:
- The 10-year Treasury yield hit about 5.3% on Thursday, its highest since 2002, then eased to around 5.22%. The 30-year yield is near 5.6%.
- Rising long-end yields remain a headwind for equity valuations, while any pullback in yields has supported stocks lately.
🛢️ Energy & Geopolitics:
- The US-Iran conflict remains a live headline risk for oil and inflation expectations.
- Oil fell today on EU stockpile release reports, but China's refiners reportedly banned October fuel exports, so energy remains volatile in both directions.
🇯🇵 Japan: Tokyo core CPI accelerated to 2.7%, giving the yen a bid early today.
💵 Dollar: DXY is near multi-month highs (about 17-month highs) around 102 earlier this week before easing today.
🏢 Earnings & Index News:
- Micron's strong results boosted chip stocks on Thursday.
- Nike fell on a downbeat earnings report.
- Moderna is replacing Warner Bros in the NASDAQ 100 index.
🗓️ UPCOMING NEWS (LONDON / BST TIME)
- Mon 05 Oct, 15:00: US ISM Services PMI (September). Fed's Goolsbee speaks
- Tue 06 Oct: Fed's Williams and Bowman speak
- Wed 07 Oct, 19:00: FOMC Minutes (September meeting)
- Thu 08 Oct, 13:30: US Initial Jobless Claims
- Wed 14 Oct, 13:30: US CPI (September)
- Wed 28 Oct, 18:00 (London time): FOMC interest rate decision
High-impact news can cause sharp spikes and slippage. Many traders reduce size or stay flat around these events.
--------------------------------------------------------------------------------
🚨 RISK DISCLAIMER
This is my personal market view, shared for educational and idea-sharing purposes only. It is not financial advice and not a recommendation to buy or sell anything. My TP and SL levels are reference points, not mandatory instructions. CFDs are leveraged products and carry a high risk of loss. Trade at your own risk, use your own analysis, and only risk what you can afford to lose. 🛡️
--------------------------------------------------------------------------------
💬 THIEF TRADER WISDOM & WISHES
"A smart thief doesn't chase the vault, he waits for the guards to look the other way." 🕶️
"Patience is the master key. Greed is the alarm bell." 🔑🔔
"Take your loot, leave before the police arrive, and come back to heist another day." 🏃♂️💰
Wishing all my Thief OG's a calm mind, sharp eyes and disciplined risk management. 🤝❤️ Stay safe, stay sharp, and let the market pay you in patience! 🏴☠️💎
If this idea gave you value, hit that LIKE 👍, FOLLOW 🔔 and drop your thoughts in the COMMENTS 💬. Your support keeps the heist crew rolling! 🚀
See you at the next heist plan. Keep stealing the market, responsibly! 🏴☠️💸
--------------------------------------------------------------------------------

Exención de responsabilidad
La información y las publicaciones no constituyen, ni deben considerarse como, asesoramiento o recomendaciones financieras, de inversión, de trading u otro tipo, proporcionadas o respaldadas por TradingView. Obtenga más información en Condiciones de uso.
Exención de responsabilidad
La información y las publicaciones no constituyen, ni deben considerarse como, asesoramiento o recomendaciones financieras, de inversión, de trading u otro tipo, proporcionadas o respaldadas por TradingView. Obtenga más información en Condiciones de uso.