
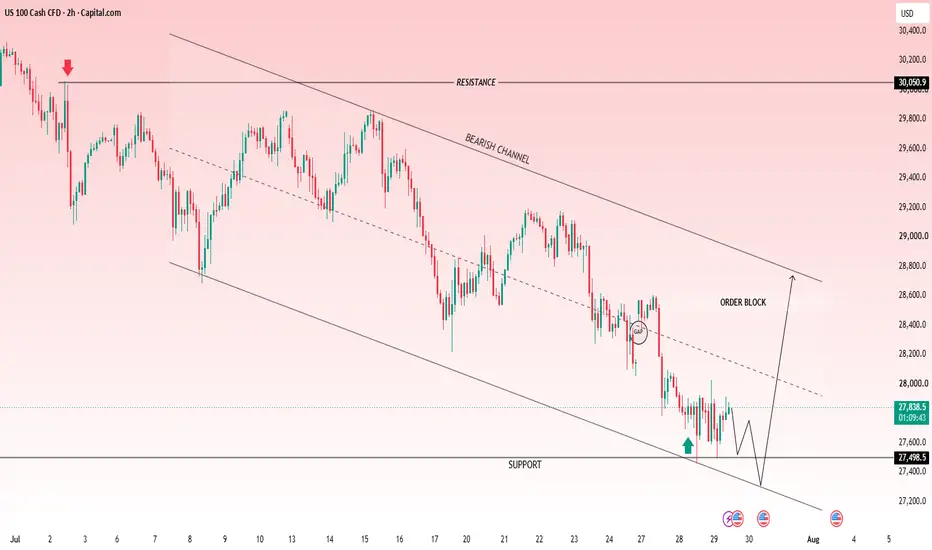
📉 US100 (NASDAQ) Technical Analysis – Bearish Structure in Focus 🔥
The US100 remains under strong bearish pressure, trading inside a well-defined descending channel. Price is hovering just above a major support zone around 27,500, where buyers are attempting to defend the level.
🧠 Market Structure
📉 Overall trend remains bearish below the descending trendline.
🛑 A previous order block near 28,450–28,600 is acting as strong resistance.
⚠️ A gap/FVG has been left behind, which may attract a short-term retracement before the next move.
🎯 The marked support is the key decision zone for the next breakout.
📊 Trading Outlook
🔻 Bearish Scenario (Preferred):
A confirmed break below 27,500 could accelerate selling.
🎯 Targets:
TP1: 27,300
TP2: 27,000
TP3: 26,600
🟢 Bullish Recovery Scenario:
If support holds, expect a relief rally toward the 28,450–28,600 Order Block.
A breakout above that area would weaken the bearish outlook.
⚡ Conclusion
📌 The trend remains bearish until price breaks above the descending channel and order block resistance. Watch 27,500 closely—it is the key level that will likely determine the next major move. 🚀📉
Operación activa
📈 **The setup is playing out exactly as expected—price is steadily advancing toward the take-profit target. 🎯**

✦ MARKET STRATEGY SIGNALS ✦ 📊
Smart Money • Price Action • Precision • good entries
📲 Join Telegram: t.me/marketstrategyentry
Smart Money • Price Action • Precision • good entries
📲 Join Telegram: t.me/marketstrategyentry
Publicaciones relacionadas
Exención de responsabilidad
La información y las publicaciones no constituyen, ni deben considerarse como, asesoramiento o recomendaciones financieras, de inversión, de trading u otro tipo, proporcionadas o respaldadas por TradingView. Obtenga más información en Condiciones de uso.