
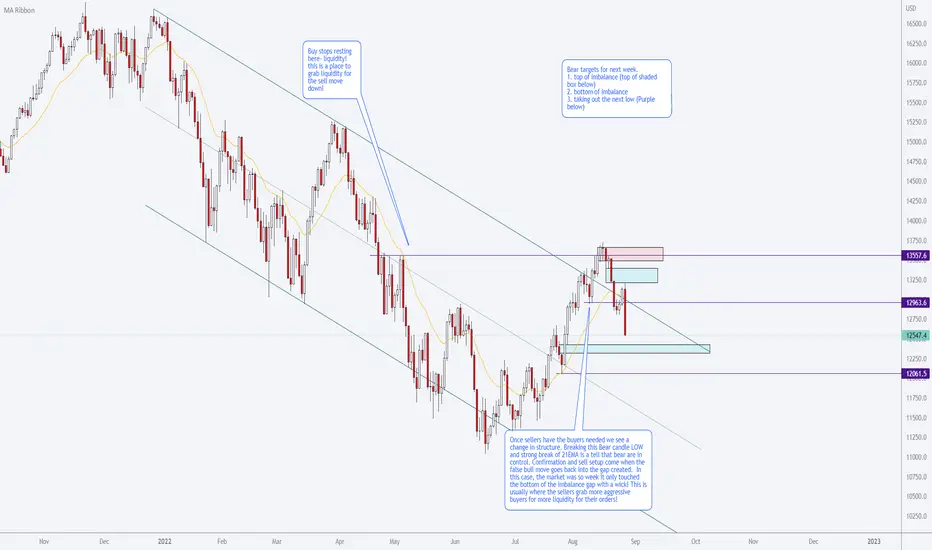
How to know the uptrend changed - where do the sellers take control? How do you read the chart and see the sellers push buyers into the trap. Nice example of where the buyers that looked for continuation of the uptrend missed the story the chart was telling. Good less that trendlines are only PART of the picture. So where are we going from here? I see some short term targets below to look for in the coming week. Note these are areas of PA interest, not trade calls or callouts to short the NQ market! Educational purposes only here. Trade your own account as you see fit and happy trading!
Nota
We are looking to get buyers up into this pink liquidity void. The better sell area will be above in the potential order block above (Blue) The idea being we are still bearish in HTFs and Sellers need some buyside before taking out lower targets. Daily/Intraday setups that give good R:R will be looked for on the LTFs. Lets see how we go. Happy trading! 
Happy trading folks
- Doc
ps - see my profile for X profile where i show trades taken and tracked screenshots
- Doc
ps - see my profile for X profile where i show trades taken and tracked screenshots
Publicaciones relacionadas
Exención de responsabilidad
La información y las publicaciones no constituyen, ni deben considerarse como, asesoramiento o recomendaciones financieras, de inversión, de trading u otro tipo, proporcionadas o respaldadas por TradingView. Obtenga más información en Condiciones de uso.
Happy trading folks
- Doc
ps - see my profile for X profile where i show trades taken and tracked screenshots
- Doc
ps - see my profile for X profile where i show trades taken and tracked screenshots
Publicaciones relacionadas
Exención de responsabilidad
La información y las publicaciones no constituyen, ni deben considerarse como, asesoramiento o recomendaciones financieras, de inversión, de trading u otro tipo, proporcionadas o respaldadas por TradingView. Obtenga más información en Condiciones de uso.