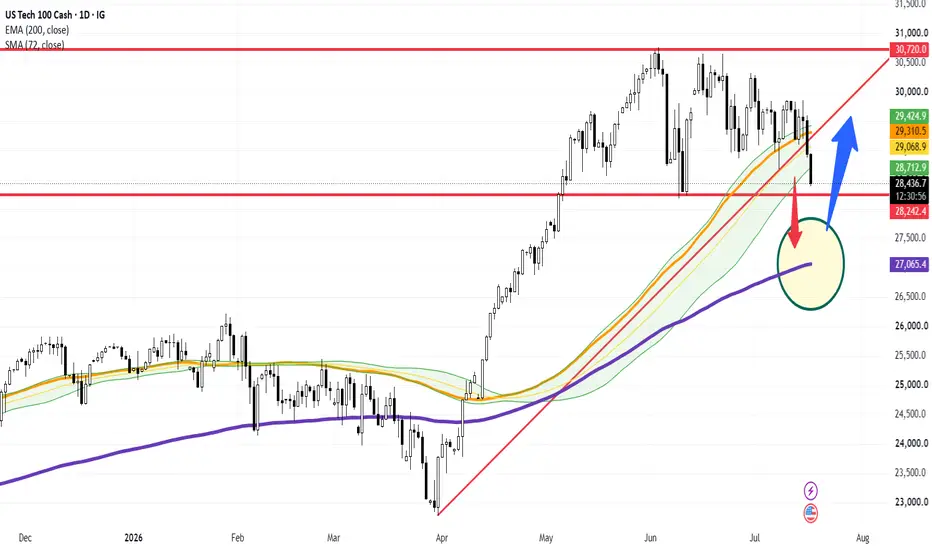
US Tech 100 ( NDX) Daily: Testing Key Support Shelf at 28,242 – Potential 200-EMA Correction Trigger
### 🇺🇸 US Tech 100 Cash (NASDAQ) Daily Structural Analysis (Ref: NASDAQ_2026-07-17_09-23-30.png)
We are tracking a critical structural pivot on the US Tech 100 (NASDAQ) daily (1D) interval. After printing a historic double-top style distribution pattern near the **30,720.00** major supply zone, the index has experienced a sharp technical markdown, slicing through key trend dynamics.
The index is currently trading under significant pressure at **28,404.60 (-1.87%)**, fast-approaching a major make-or-break horizontal baseline.
---
### 🔍 Key Technical Structures & Breakout Mechanics:
1. **The Primary Trendline Breakdown:** The aggressive daily candle has officially broken below the long-term **Ascending Support Trendline (red diagonal LTA)** which had anchored the entire bullish trend since the major bottom near **23,000** in April.
2. **The Dynamic EMA/SMA Squeeze:** Price has also closed cleanly below both the **72-period SMA (yellow line currently at 29,310.10)** and the short-term EMA band, invalidating previous dynamic support clusters.
3. **The Line in the Sand (28,242.40):** The immediate focus of this study is the critical horizontal support shelf plotted at **28,242.40** (the lower red horizontal line). This level marks the ultimate structural defense for buyers.
---
### 📉 Bearish Continuation: Target 200-EMA (27,200 - 27,000)
As highlighted by our red downward tracking vector inside the target circle:
* **The Daily Close Confirmation Trigger:** If the daily candle registers a confirmed close **below 28,242.40**, the local bearish momentum will be officially validated, confirming a structural shift from "pullback" to a "deeper corrective cycle".
* **First Major Target - The 200-EMA Cluster:** Breaking this floor opens a direct technical vacuum down to the **200-period EMA (purple line currently rising at 27,065.10)**. This institutional average converges beautifully with the demand zone of **27,200.00 - 27,000.00** (previous consolidation and structural gap from May). This is where major players are highly likely to step in to defend the long-term trend.
---
### 🔄 Alternative Bullish Scenario (The Blue Vector)
* **The Liquidity Sweep & Spring:** Traders should watch for a potential "bear trap." If the index sweeps below 28,240 to grab sell-stops but quickly recovers to close the day back above the support line, it would print a bullish rejection candle (e.g., hammer or pin bar).
* Such a reaction could trigger a sharp relief rally (blue arrow) back toward the broken LTA and the 72-SMA area (~29,310) to retest the newly formed resistance.
### 📊 Tactical Trading Parameters:
* **Current Bias:** Neutral-Bearish (testing major support)
* **Major Breakdown Trigger:** Confirmed Daily Close below 28,242.40
* **Downside Targets:** 27,200.00 - 27,065.00 (200-EMA Area)
* **Upside Resistance:** 29,310.10 (72-SMA) & 29,424.80
* **Invalidation Anchor:** Daily Close reclaiming a position back above 29,425.00
---
📊 **ChartPro Data**
*US Tech Architecture, Structural Range Breakouts & High-Probability Trend Confluences.*
⚠️ **Disclaimer:** For educational and informational purposes only. This active market study represents a personal trading framework and does not constitute financial or investment advice.
NDX) Daily: Testing Key Support Shelf at 28,242 – Potential 200-EMA Correction Trigger### 🇺🇸 US Tech 100 Cash (NASDAQ) Daily Structural Analysis (Ref: NASDAQ_2026-07-17_09-23-30.png)
We are tracking a critical structural pivot on the US Tech 100 (NASDAQ) daily (1D) interval. After printing a historic double-top style distribution pattern near the **30,720.00** major supply zone, the index has experienced a sharp technical markdown, slicing through key trend dynamics.
The index is currently trading under significant pressure at **28,404.60 (-1.87%)**, fast-approaching a major make-or-break horizontal baseline.
---
### 🔍 Key Technical Structures & Breakout Mechanics:
1. **The Primary Trendline Breakdown:** The aggressive daily candle has officially broken below the long-term **Ascending Support Trendline (red diagonal LTA)** which had anchored the entire bullish trend since the major bottom near **23,000** in April.
2. **The Dynamic EMA/SMA Squeeze:** Price has also closed cleanly below both the **72-period SMA (yellow line currently at 29,310.10)** and the short-term EMA band, invalidating previous dynamic support clusters.
3. **The Line in the Sand (28,242.40):** The immediate focus of this study is the critical horizontal support shelf plotted at **28,242.40** (the lower red horizontal line). This level marks the ultimate structural defense for buyers.
---
### 📉 Bearish Continuation: Target 200-EMA (27,200 - 27,000)
As highlighted by our red downward tracking vector inside the target circle:
* **The Daily Close Confirmation Trigger:** If the daily candle registers a confirmed close **below 28,242.40**, the local bearish momentum will be officially validated, confirming a structural shift from "pullback" to a "deeper corrective cycle".
* **First Major Target - The 200-EMA Cluster:** Breaking this floor opens a direct technical vacuum down to the **200-period EMA (purple line currently rising at 27,065.10)**. This institutional average converges beautifully with the demand zone of **27,200.00 - 27,000.00** (previous consolidation and structural gap from May). This is where major players are highly likely to step in to defend the long-term trend.
---
### 🔄 Alternative Bullish Scenario (The Blue Vector)
* **The Liquidity Sweep & Spring:** Traders should watch for a potential "bear trap." If the index sweeps below 28,240 to grab sell-stops but quickly recovers to close the day back above the support line, it would print a bullish rejection candle (e.g., hammer or pin bar).
* Such a reaction could trigger a sharp relief rally (blue arrow) back toward the broken LTA and the 72-SMA area (~29,310) to retest the newly formed resistance.
### 📊 Tactical Trading Parameters:
* **Current Bias:** Neutral-Bearish (testing major support)
* **Major Breakdown Trigger:** Confirmed Daily Close below 28,242.40
* **Downside Targets:** 27,200.00 - 27,065.00 (200-EMA Area)
* **Upside Resistance:** 29,310.10 (72-SMA) & 29,424.80
* **Invalidation Anchor:** Daily Close reclaiming a position back above 29,425.00
---
📊 **ChartPro Data**
*US Tech Architecture, Structural Range Breakouts & High-Probability Trend Confluences.*
⚠️ **Disclaimer:** For educational and informational purposes only. This active market study represents a personal trading framework and does not constitute financial or investment advice.

Exención de responsabilidad
La información y las publicaciones no constituyen, ni deben considerarse como, asesoramiento o recomendaciones financieras, de inversión, de trading u otro tipo, proporcionadas o respaldadas por TradingView. Obtenga más información en Condiciones de uso.
Exención de responsabilidad
La información y las publicaciones no constituyen, ni deben considerarse como, asesoramiento o recomendaciones financieras, de inversión, de trading u otro tipo, proporcionadas o respaldadas por TradingView. Obtenga más información en Condiciones de uso.