nasdaq100....h
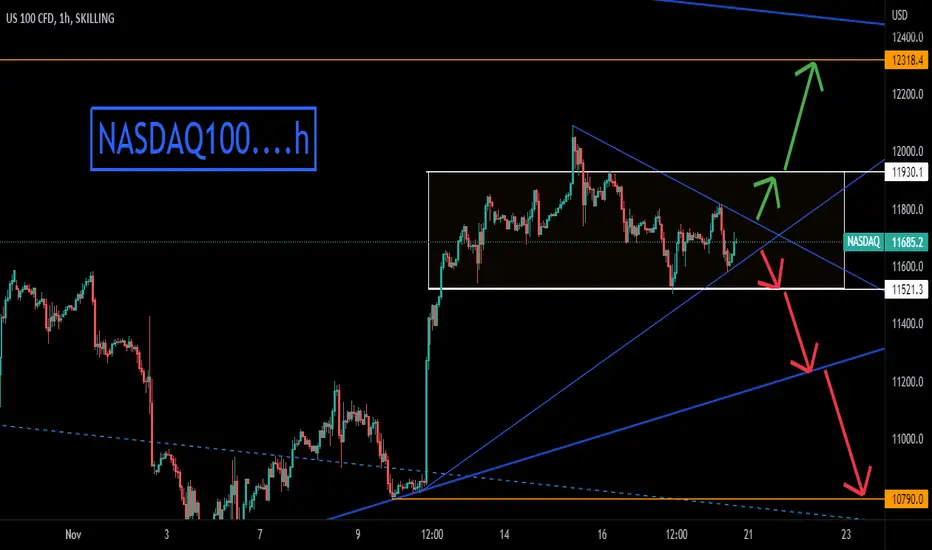
= Nasdaq analysis on the hourly chart
= The analysis is based on trend analysis, support and resistance
= Currently, it is on an occasional path between support and resistance.. breaking it goes to the selling targets... and exceeding it goes to the buying targets
= The analysis is based on trend analysis, support and resistance
= Currently, it is on an occasional path between support and resistance.. breaking it goes to the selling targets... and exceeding it goes to the buying targets

Exención de responsabilidad
La información y las publicaciones no constituyen, ni deben considerarse como, asesoramiento o recomendaciones financieras, de inversión, de trading u otro tipo, proporcionadas o respaldadas por TradingView. Obtenga más información en Condiciones de uso.
Exención de responsabilidad
La información y las publicaciones no constituyen, ni deben considerarse como, asesoramiento o recomendaciones financieras, de inversión, de trading u otro tipo, proporcionadas o respaldadas por TradingView. Obtenga más información en Condiciones de uso.