
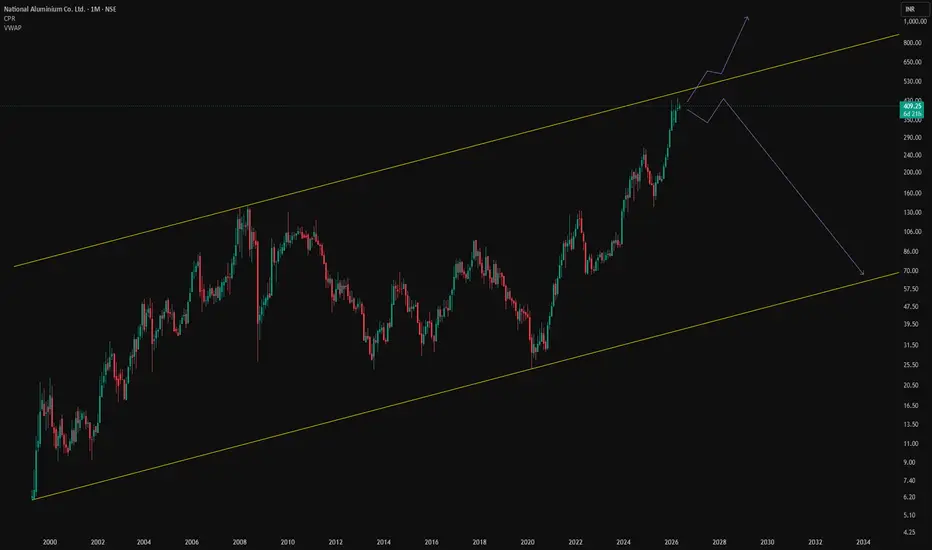
National Aluminium Company Limited is currently approaching the upper boundary of a long-term rising channel on the monthly logarithmic timeframe. The stock has respected this channel structure for many years, and price is now trading near a historically significant resistance zone.
From a pure channel-pattern perspective, the probability of corrective movement or consolidation increases when price reaches the upper trendline after an extended rally. As long as the stock remains inside the channel, the broader long-term structure remains intact.
Technical observations:
Multi-year ascending channel clearly visible on the monthly chart.
Price is testing the upper boundary resistance of the channel.
Historically, previous interactions near channel extremes resulted in directional reversals or consolidation phases.
A corrective move toward the mid or lower region of the channel cannot be ruled out over the coming months.
A decisive breakout above the channel may invalidate the corrective view and extend bullish momentum further.
This analysis is purely based on long-term channel structure and price positioning within the trend boundaries.
Disclaimer:
This chart analysis is for educational and informational purposes only and should not be considered financial advice or an investment recommendation. Please do your own research and practice proper risk management before taking any trade or investment decision.
From a pure channel-pattern perspective, the probability of corrective movement or consolidation increases when price reaches the upper trendline after an extended rally. As long as the stock remains inside the channel, the broader long-term structure remains intact.
Technical observations:
Multi-year ascending channel clearly visible on the monthly chart.
Price is testing the upper boundary resistance of the channel.
Historically, previous interactions near channel extremes resulted in directional reversals or consolidation phases.
A corrective move toward the mid or lower region of the channel cannot be ruled out over the coming months.
A decisive breakout above the channel may invalidate the corrective view and extend bullish momentum further.
This analysis is purely based on long-term channel structure and price positioning within the trend boundaries.
Disclaimer:
This chart analysis is for educational and informational purposes only and should not be considered financial advice or an investment recommendation. Please do your own research and practice proper risk management before taking any trade or investment decision.

Exención de responsabilidad
La información y las publicaciones no constituyen, ni deben considerarse como, asesoramiento o recomendaciones financieras, de inversión, de trading u otro tipo, proporcionadas o respaldadas por TradingView. Obtenga más información en Condiciones de uso.
Exención de responsabilidad
La información y las publicaciones no constituyen, ni deben considerarse como, asesoramiento o recomendaciones financieras, de inversión, de trading u otro tipo, proporcionadas o respaldadas por TradingView. Obtenga más información en Condiciones de uso.