
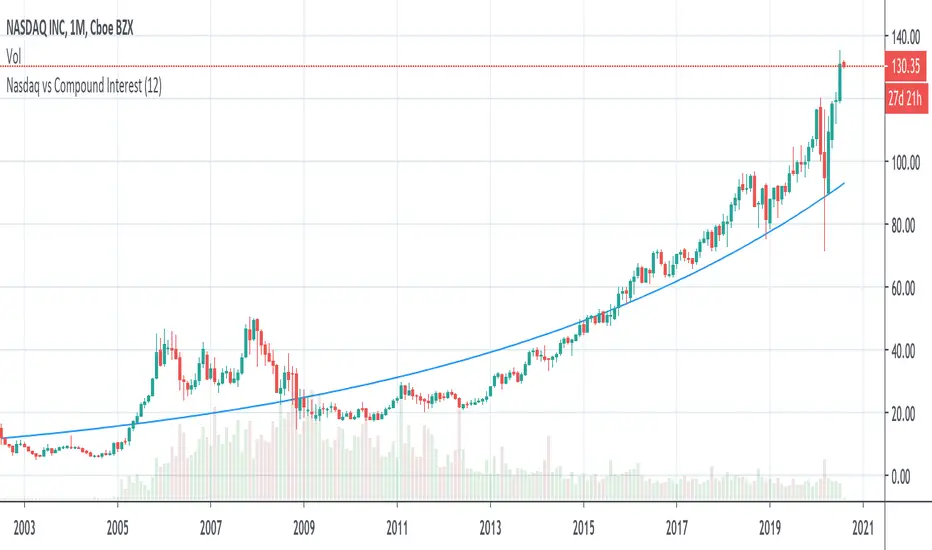
By comparing Nasdaq with historical returns it seems Nasdaq returns are aligning with 12% annually compounded rate. If Nasdaq has similar potential in the future this graph can help in understanding oversold or overbought positions for the long term.
If the index is far below the compounding rate line, it indicates that the index has the potential to give more returns down the line. The longer gap and longer duration have a higher probability.
If the index is far below the compounding rate line, it indicates that the index has the potential to give more returns down the line. The longer gap and longer duration have a higher probability.

Publicaciones relacionadas
Exención de responsabilidad
La información y las publicaciones no constituyen, ni deben considerarse como, asesoramiento o recomendaciones financieras, de inversión, de trading u otro tipo, proporcionadas o respaldadas por TradingView. Obtenga más información en Condiciones de uso.