
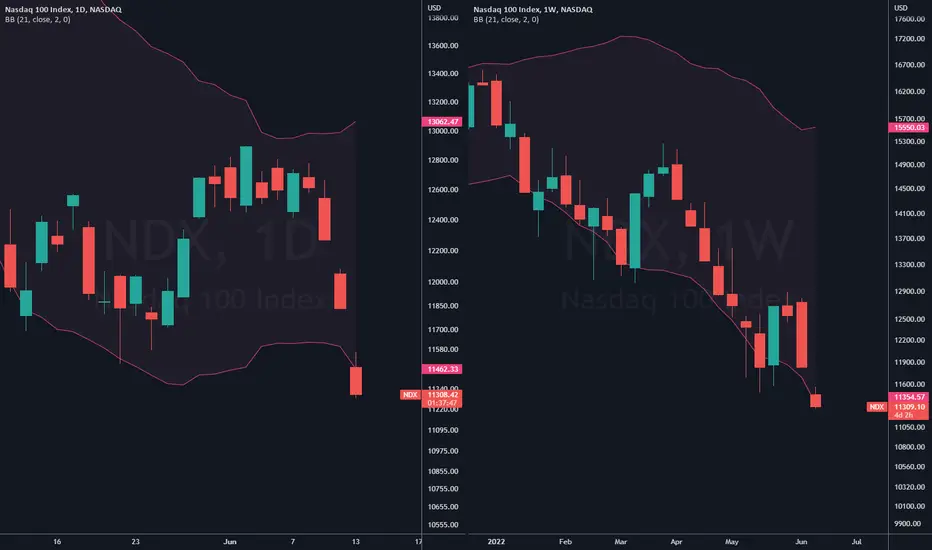
After 4 days of intense selling, we're back to new cycle drawdown lows in the Nasdaq-100. Meanwhile, the selling has pushed us below the lower Bollinger Bands on multiple time-frames (weekly chart left and daily chart right). It's nasty out there.

Evan Medeiros
Founder, Trade Risk
---
Website: thetraderisk.com
Twitter: twitter.com/evanmedeiros
Latest Analysis: thetraderisk.com/smw
Free Newsletter: thetraderisk.com/trading-newsletter
Founder, Trade Risk
---
Website: thetraderisk.com
Twitter: twitter.com/evanmedeiros
Latest Analysis: thetraderisk.com/smw
Free Newsletter: thetraderisk.com/trading-newsletter
Exención de responsabilidad
La información y las publicaciones no constituyen, ni deben considerarse como, asesoramiento o recomendaciones financieras, de inversión, de trading u otro tipo, proporcionadas o respaldadas por TradingView. Obtenga más información en Condiciones de uso.
Evan Medeiros
Founder, Trade Risk
---
Website: thetraderisk.com
Twitter: twitter.com/evanmedeiros
Latest Analysis: thetraderisk.com/smw
Free Newsletter: thetraderisk.com/trading-newsletter
Founder, Trade Risk
---
Website: thetraderisk.com
Twitter: twitter.com/evanmedeiros
Latest Analysis: thetraderisk.com/smw
Free Newsletter: thetraderisk.com/trading-newsletter
Exención de responsabilidad
La información y las publicaciones no constituyen, ni deben considerarse como, asesoramiento o recomendaciones financieras, de inversión, de trading u otro tipo, proporcionadas o respaldadas por TradingView. Obtenga más información en Condiciones de uso.